
Global monetary update: minor recovery stalling?
 Simon Ward
 1 Comment
Global six-month real narrow money momentum – a key leading indicator in the forecasting approach employed here – has recovered from a low in September 2023 but remains negative and could be stalling. Allowing for the typical lead, this suggests a slide in economic momentum into mid-year with limited subsequent revival.
Monetary trends, therefore, cast doubt on the current market consensus view that a global cyclical upswing is under way.
The real money / economic momentum relationship is primarily directional, i.e. involving turning points rather than levels. Chart 1 highlights related troughs in six-month rates of change of global (i.e. G7 plus E7) real narrow money and industrial output since 2000. The average lead time at these lows was eight months, with a range of four to 14.
Chart 1
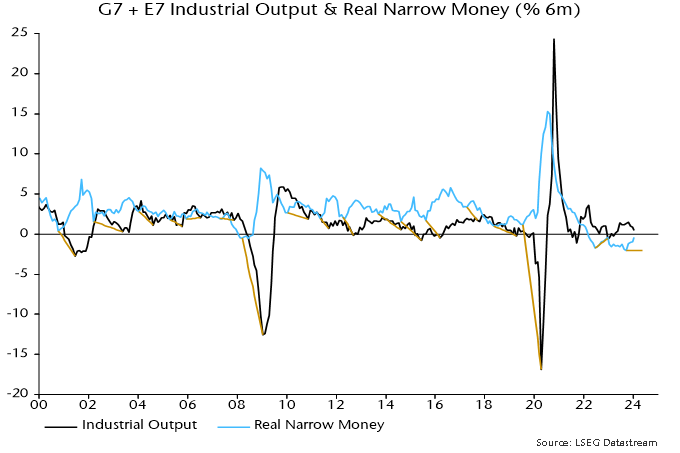
So the September 2023 low in real money momentum could be associated with an output momentum low any time between January and December 2024.
The directional relationship was briefly disrupted during the pandemic but has since been reestablished: a trough in real money momentum in June 2022 was followed by an output momentum low in December 2022, with subsequent peaks in December 2022 and October 2023 respectively.
Six-month output growth in January was the slowest since May.
While the directional relationship is intact, output momentum in 2022-23 was much stronger than suggested by prior levels of real money momentum. As previously discussed, this is probably attributable to a monetary “overhang” from rapid growth in 2020-21. The ratio of the stock of global real narrow money to industrial output returned to its March 2020 level in September last year and has since moved sideways, arguing for a normalisation of the levels relationship of real money and economic momentum.
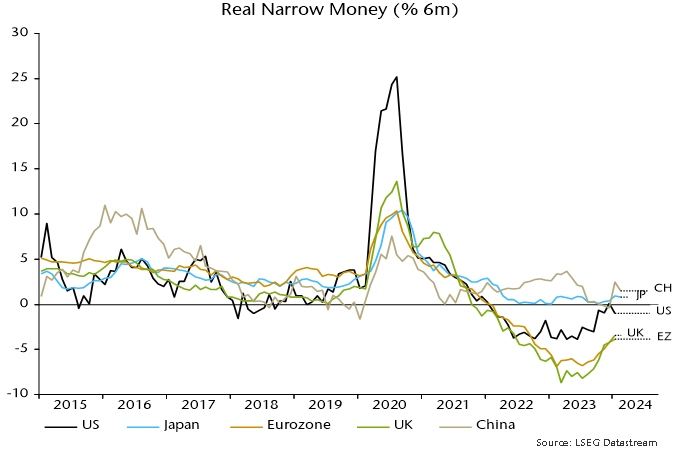
The recovery in real money momentum between September 2023 and January 2024 was broadly based across countries but the US pick-up reversed in January – see previous post – while Chinese / Japanese momentum declined in February – chart 2. So the global revival could be stalling with momentum still negative. (A February update will be provided following release of US / Eurozone monetary data next week.)
Chart 2
How do monetary signals compare with messages from the yield curve?
Chart 3 shows a longer-term history of six-month rates of change of global industrial output and real narrow money, along with the differential between GDP-weighted averages of 10-year government bond yields and three-month money rates. (The chart splices together G7 data through 2004 with subsequent G7 plus E7 numbers.)
Chart 3
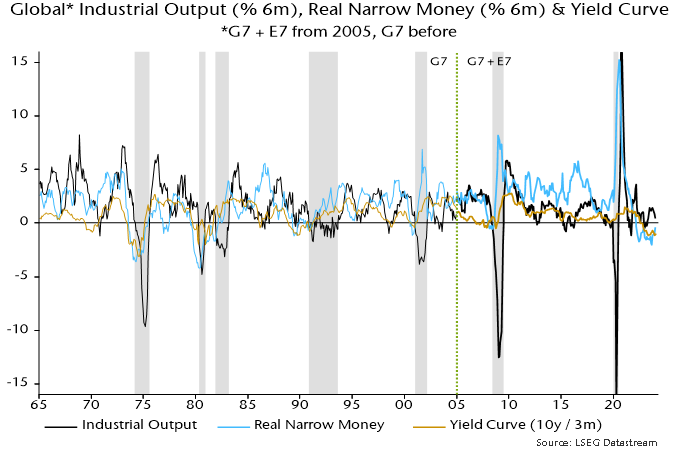
The directional leading relationship between real money and economic momentum is equally convincing pre-2000, with a similar average lead time.
The yield curve has broadly mirrored trends in real money momentum, with a slight tendency for money to lead. However, the curve predicted fewer output momentum turning points, particularly in recent years, i.e. monetary signals have been more informative and reliable.
Continued yield curve inversion is consistent with still-negative real money momentum. An increase in inversion since October, moreover, contrasts with the recent monetary recovery, supporting concern that the latter may be stalling.
Combinations of negative real money momentum and an inverted curve were always followed by global recessions. The longest interval between a joint signal and recession onset was in 1989-90: real money momentum and the yield curve were both negative in April 1989, with a recession judged to have started in November 1990*.
The most recent joint signal occurred in October 2022, when the yield curve moved into inversion. Based on history, a recession would be expected by May 2024 at the latest. Are markets premature in sounding the all-clear? Assuming no downturn through May, should the signal be disregarded? Do I feel lucky?
*The recession bands in the chart begin when the six-month change in industrial output turns negative ahead of a fall to below -1.25% (not annualised).
Why UK payrolls data could be misleading economy bulls
Perceptions of UK labour market “resilience” rest partly on continued growth in the payrolled employees series, based on PAYE data. This series, however, is likely to have been boosted by a rise in the proportion of self-employed people included in PAYE.
Labour Force Survey (LFS) employment is, at least in concept, the most comprehensive measure of employed people, including all employees and self-employed. The payrolled employees series covers most employees* along with self-employed people who receive pay through PAYE. The latter group includes business owners who choose to draw a salary, contractors on the payroll of the client and self-employed people with second jobs as employees.
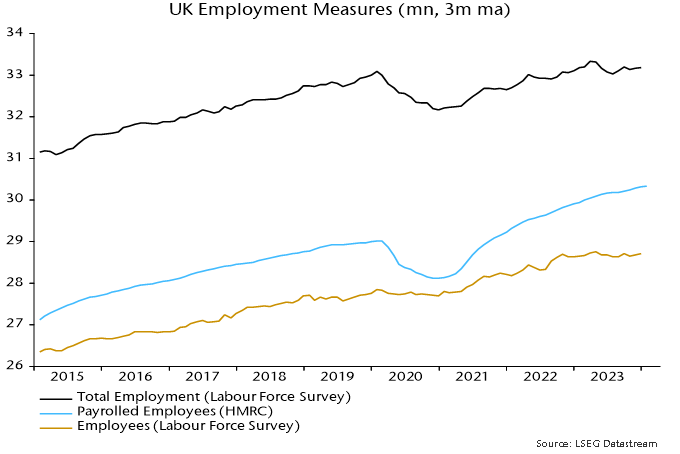
LFS employment peaked in the three months to April 2023, standing 150,000 below that level in the three months to January. This is consistent with GDP / gross value added data indicating a recession starting in Q2 2023.
The payrolled employees series, by contrast, grew by 270,000 over the same interval.
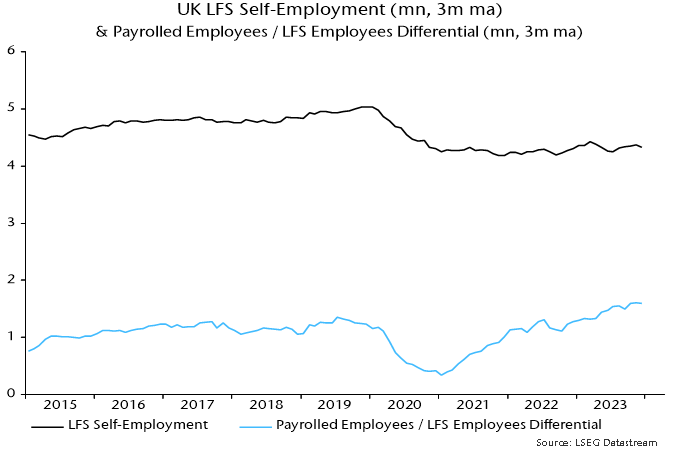
This continues a longer-term divergence. LFS employment in the latest three months was 85,000 above its pre-pandemic peak, reached in the three months to February 2020. Payrolled employees have increased by 1.3 million since then – see chart 1.
Chart 1
There are two reasons for suspecting that the payrolled employees series has been swollen by increased PAYE coverage of the self-employed. First, reform of IR35 rules in the private sector in April 2021 are likely to have resulted in some contractors being moved onto clients’ payrolls.
Secondly, the number of employee jobs has risen by more than employee numbers, suggesting a rise in multiple job-holding**. This may have resulted in some people identifying as self-employed in the LFS being picked up in PAYE.
LFS self-employment was 4.33 million in the three months to January. A rough guide to the number included in PAYE is the difference between the payrolled employees series and the LFS measure of employees – 1.6 million.
Chart 2 shows that the latter differential mirrored changes in LFS self-employment until early 2021. It then embarked on a rising trend while LFS self-employment moved sideways. The timing is consistent with an impact from the IR35 reform.
Chart 2
The rise in the payrolled employees / LFS employees differential is unlikely to be solely attributable to increased PAYE coverage of the self-employed. The decline in quality of LFS data due to a falling response rate may have been associated with underrecording of growth in employee numbers.
The payrolled employees series, nevertheless, warrants a health warning and its relative strength should be at least partly discounted, particularly as it jars with other evidence including an ongoing fall in vacancies, rising claimant unemployment, weak REC jobs reports and a recent increase in redundancies.
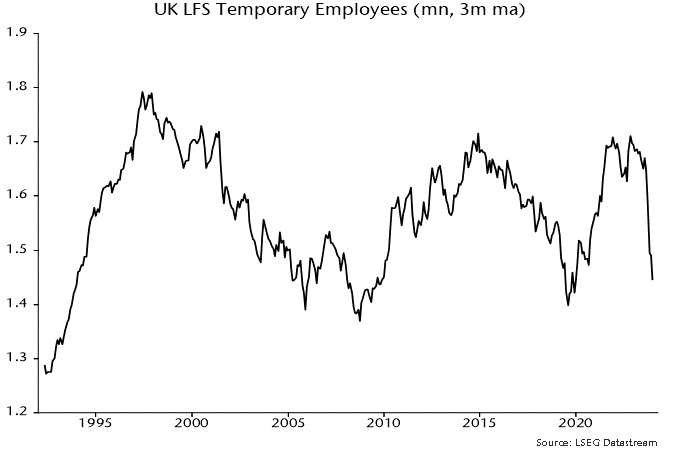
Addendum: Falling US temporary help services employment has been a harbinger of weakness in aggregate payrolls historically. UK LFS temporary employment has a patchier record as a leading indicator but a plunge since the summer is eye-catching – chart 3.
Chart 3
*It does not include employees of companies paying below the national insurance lower earnings limit.
**The Workforce Jobs dataset shows a rise in employee jobs of 1.79 million between Q4 2019 and Q4 2023 versus a 955,000 increase in the LFS measure of employee numbers over the same period.
Weaker US business money trends
The Fed’s quarterly financial accounts provide information on sector money trends and funds flows. Several features of the Q4 accounts, released last week, are noteworthy.
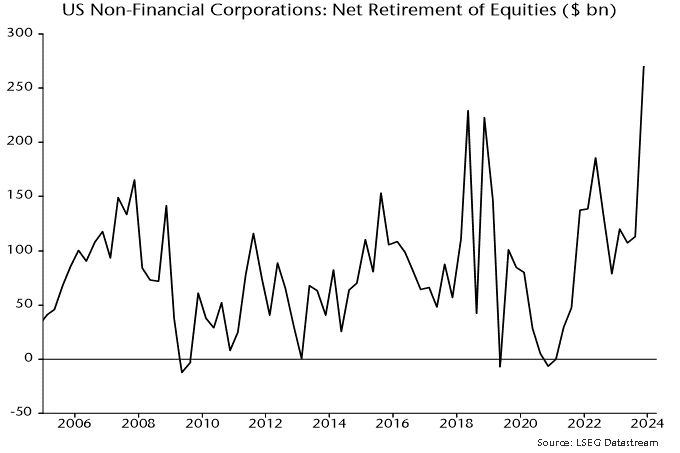
First, net retirement of equities by non-financial corporations (via buy-backs and cash take-overs) reached a record dollar amount ($270 billion) in Q4, confirming that corporate buying was a key driver of the year-end rally – see chart 1.
Chart 1
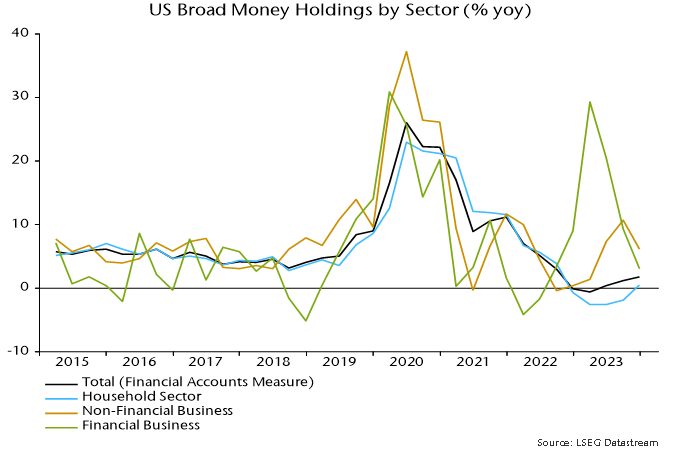
The rise in equity purchases followed strong growth of non-financial business broad money holdings in the year to end-Q3, discussed in a previous post. Such holdings, however, contracted slightly in Q4, pulling annual growth down from 10.6% to 6.2% – chart 2.
Chart 2
Financial business money holdings had surged in the year to end-Q1 2023, perhaps partly reflecting cash-raising related to equity market weakness in 2022. These balances were run down during H2, though still finished the year slightly higher than at end-2022.
The recent weaker trends in non-financial and financial business money suggest less buying support for equities and other risk assets going forward.
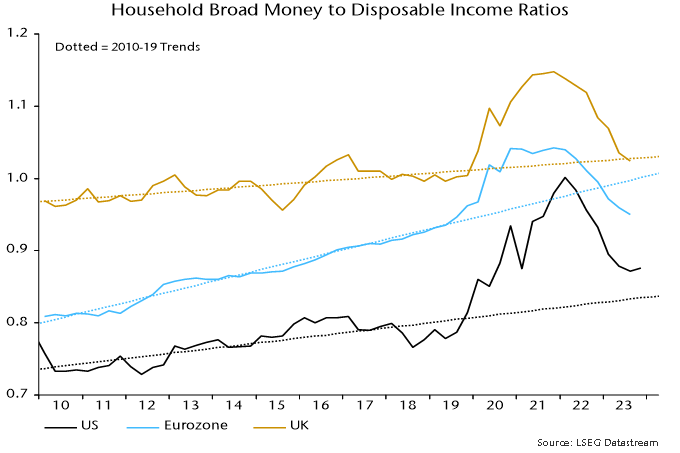
Household broad money, by contrast, rose solidly in Q4, resulting in the annual change returning to positive territory. The ratio of money holdings to disposable income recovered slightly following six consecutive quarterly declines, remaining above its pre-pandemic trend, in contrast to shortfalls for corresponding Eurozone and UK ratios – chart 3.
Chart 3
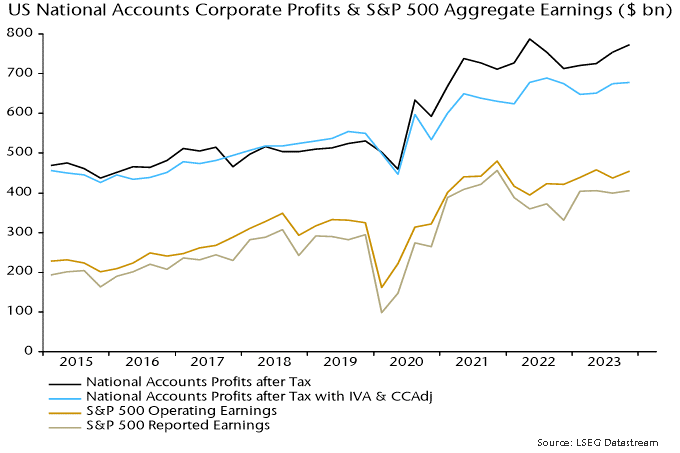
The Q4 financial accounts also contain initial estimates of corporate profits and gross domestic income (GDI). Profits after tax adjusted for stock appreciation and economic depreciation rose at a 2.5% annualised rate last quarter and remain below a peak reached in Q3 2022 – chart 4, blue line. The range-bound movement is consistent with S&P 500 earnings data and questions perceptions of economic / profits strength.
Chart 4
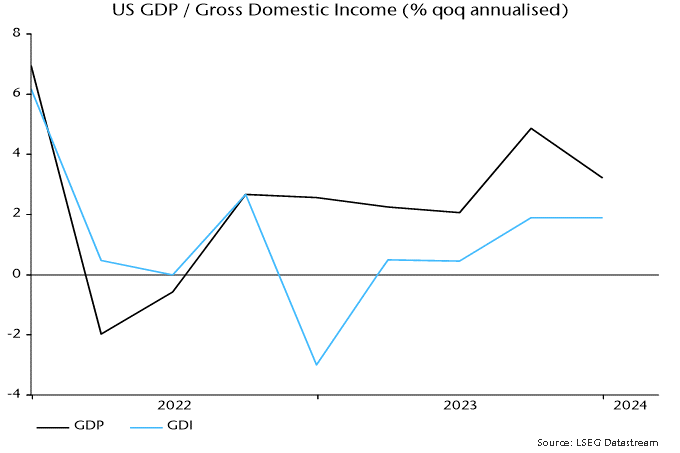
GDI is an alternative estimate of GDP and has consistently lagged the headline expenditure-based measure in recent quarters – see previous post. It did so again in Q4, rising at a 1.9% annualised rate versus headline GDP growth of 3.2% - chart 5. GDI grew by just 1.2% in the year to Q4.
Chart 5
Weaker US monetary data
US monetary conditions eased during H2 2023, reflecting the Treasury’s decision to skew debt issuance towards bills and the Fed’s December pivot. This loosening is now reversing, partly because of the recent sticky inflation scare and associated back-up in yields, and prospectively as the Treasury scales back bill financing in Q2.
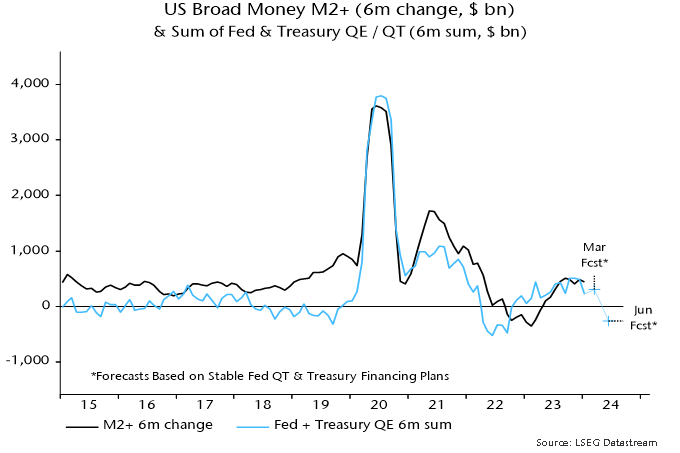
January monetary statistics are consistent with a turnaround. The narrow M1A measure followed here contracted by 1.4% on the month, more than reversing a 1.0% December gain. Broad money M2+ stagnated after a 0.8% December rise*.
Six-month M2+ growth appears to be rolling over in line with the forecast in a previous post – see chart 1. To recap, sales of Treasury bills to money funds should continue to offset the monetary impact of the Fed’s QT during Q1 but the Treasury’s plans to redeem bills in Q2 imply a dramatic contractionary shift – unless the Fed simultaneously halts QT.
Chart 1
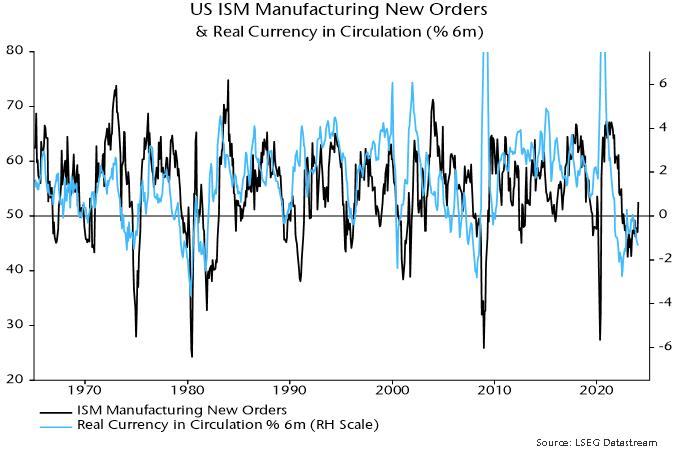
Prospective monetary weakness poses a threat to risk assets and could coincide with economic news that derails the current soft / no landing consensus. This consensus has been bolstered by a recent pick-up in the ISM manufacturing new orders index, a widely-watched cyclical indicator. A post in July signalled a coming ISM rebound but suggested that it would prove temporary.
That remains the base-case view here. A relapse is expected in reflection of global real narrow money weakness into last autumn and on the view that the 2022-23 stockbuilding cycle downswing has yet to reach a final low.
US six-month real narrow money momentum has led swings in ISM new orders historically. The currency component has displayed a slightly stronger correlation than the aggregate, probably because of a linkage with retail goods spending – chart 2. Real currency momentum signalled the current ISM recovery but has been moving lower since last summer. January retail sales weakness may have been more than weather-related and the ISM recovery may be about to abort.
Chart 2
 *M1A = currency in circulation plus demand deposits. M2+ = M2 plus large time deposits at commercial banks and institutional money funds.
Better Chinese monetary news
Chinese monetary statistics for January suggest that policy easing is starting to become effective.
Six-month growth of narrow money, as measured by true M1*, rebounded from a negative December reading to its highest level since May – see chart 1.
Chart 1
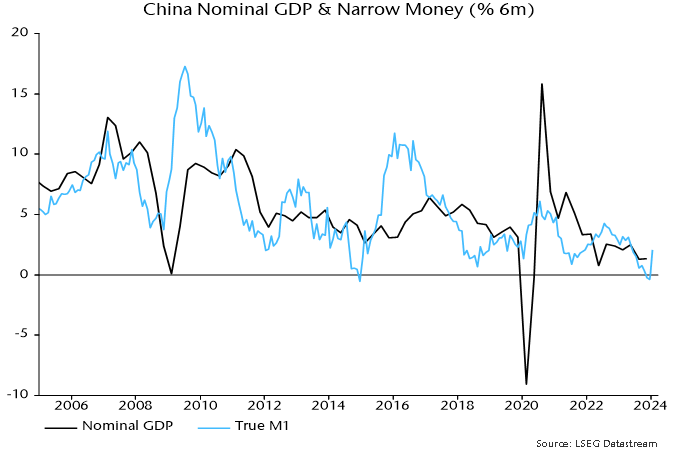
Q1 numbers can be volatile because of New Year timing effects, so improvement needs to be confirmed by February / March data.
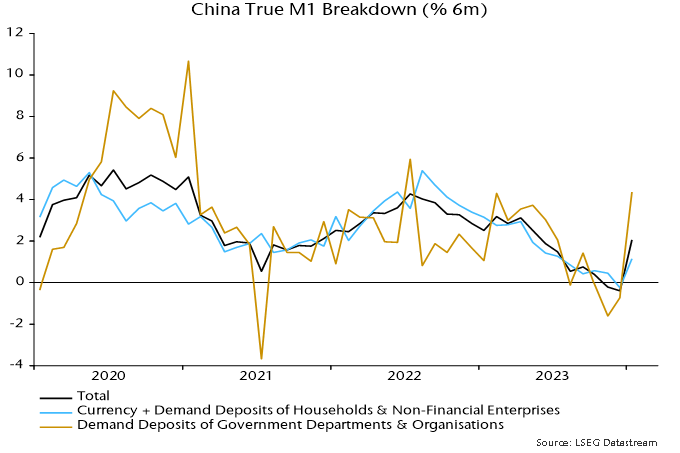
True M1 can be broken down into “private” and “public” sector components. The former aggregates currency in circulation and demand deposits of households and non-financial enterprises. The latter is calculated as a residual and is dominated by demand deposits of government departments and organisations.
Six-month growth rates of both components rose in January but the public sector increase was much larger, consistent with funds being mobilised to boost fiscal spending – chart 2.
Chart 2
Progress in implementing fiscal stimulus is also suggested by a strong rise in central government deposits – these are excluded from money definitions but deployment of funds will have a positive monetary impact.
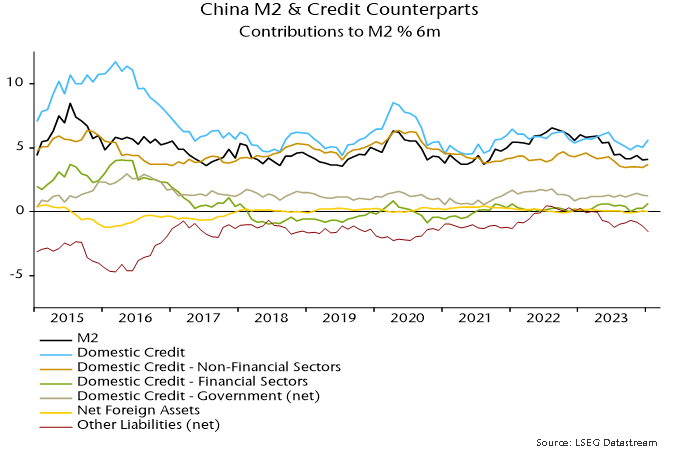
The broader M2 measure continues to outpace narrow money, with six-month growth little changed in January, extending a recent sideways movement. In terms of the “credit counterparts”, domestic credit expansion has firmed since late 2023 but there has been an offsetting increase in non-monetary funding (“other liabilities”) – chart 3.
Chart 3
A reduction in the broad / narrow money growth gap driven by narrow acceleration is usually a positive economic signal, indicating a rise in broad money velocity.
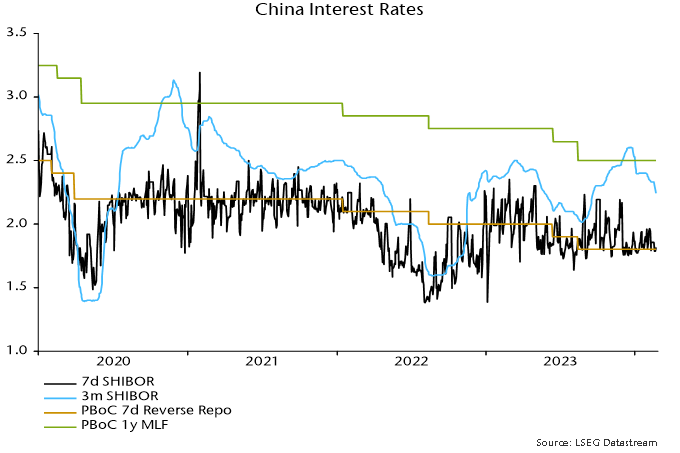
The January narrow money recovery, as noted, partly reflects implementation of fiscal spending plans. A sustained pick-up requires monetary policy to be sufficiently accommodative. Recent developments are promising. PBoC lending to the banking system grew by a record amount in Q4. Banks’ excess reserve ratio rose to 2.1%, the highest since Q4 2020 – before the recent 0.5 pp further reduction in the requirement ratio. The reserves injection has contributed to three-month SHIBOR reversing half of its August-December rise since the start of the year – chart 4. Currency weakness has remained contained despite softer rates; indeed, the JP Morgan effective index has risen slightly year-to-date.
Chart 4
Monetary deterioration into late 2023 argues for economic weakness through H1 2024. Confirmation that monetary trends have turned would suggest improving prospects for H2.
*Official M1 plus household demand deposits. M1 conventionally includes such deposits but they are omitted from the Chinese official measure for historical reasons.