
Why investors should fade a possible ISM bounce
 Simon Ward
 1 Comment
A bottoming out of the global stockbuilding cycle could be associated with a near-term recovery in manufacturing survey indicators. Money trends suggest that any revival will be modest / temporary and offset by wider economic weakness.
Economic news has been unusually mixed since end-2021, with GDP weakness contrasting with labour market strength and manufacturing deterioration offset by services resilience. Confusing signals have contributed to market hopes of a “soft landing”.
Sectoral and regional divergences may persist in H2 2023. The expectation here is that manufacturing survey weakness will abate but labour market data will worsen significantly. Money trends continue to cast strong doubt on soft landing hopes. Europe is likely to underperform the US.
The US ISM manufacturing new orders index – a widely watched indicator of industrial momentum – hit a low of 42.5 in January and retested this level in May before recovering to 45.6 in June.
Reasons for expecting a further rise include:
-
The index has been in the 40s since September 2022 and the mean duration of sub-50 periods historically was eight months (ignoring episodes of three months or less).
-
The global stockbuilding cycle remains on track to bottom out during H2 2023 and lows historically were usually preceded by a recovery in US / global manufacturing new orders.
-
Recent price falls for raw materials and other production inputs may further incentivise firms to step up purchasing to maintain or replenish inventories.
Korean manufacturing is a bellwether of US / global trends and the latest Federation of Korean Industries survey reported a marked improvement in optimism, consistent with ISM new orders moving back above 50 – see chart 1.
Chart 1
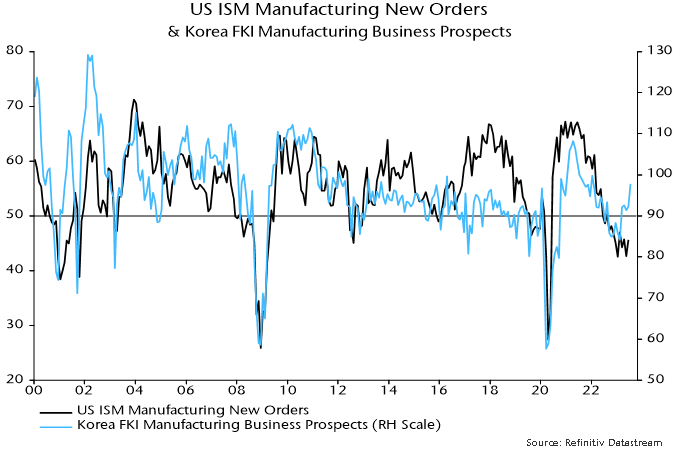
Sustained recoveries in ISM new orders from the mid 40s into expansionary territory historically occurred against a backdrop of positive and / or rising six-month real narrow money* momentum. Current trends are unfavourable, with momentum still significantly negative and moving sideways – chart 2.
Chart 2
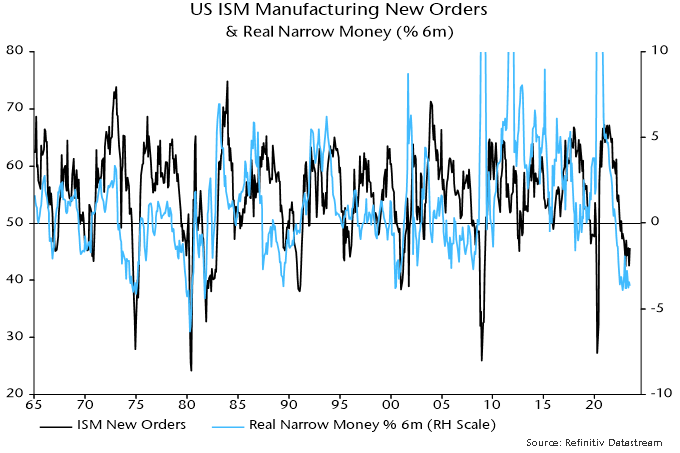
Examples of recoveries to above 50 without a supportive monetary backdrop include 1970 and 1989-90. In both cases the rise was modest (peaking below 55), short-lived and followed by a decline to a lower low. The recovery in 1970 occurred within an NBER-defined recession and in 1989-90 just before one.
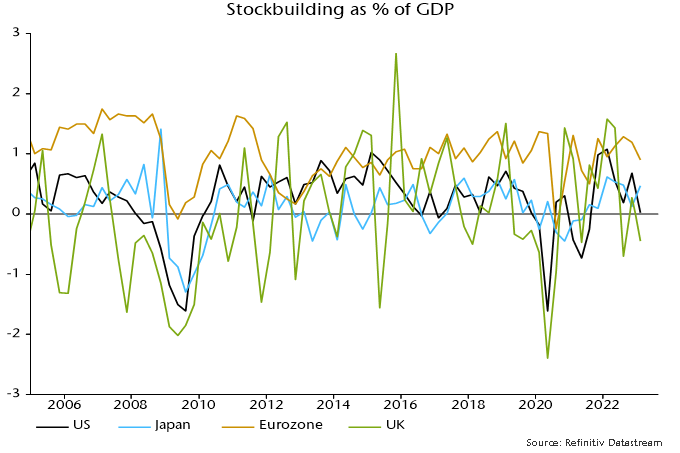
An ISM rebound might not be mirrored by much if any revival in European manufacturing surveys. Money trends are even weaker than in the US, while the stockbuilding adjustment started later in the Eurozone and probably has further to run – charts 3 and 4.
Chart 3
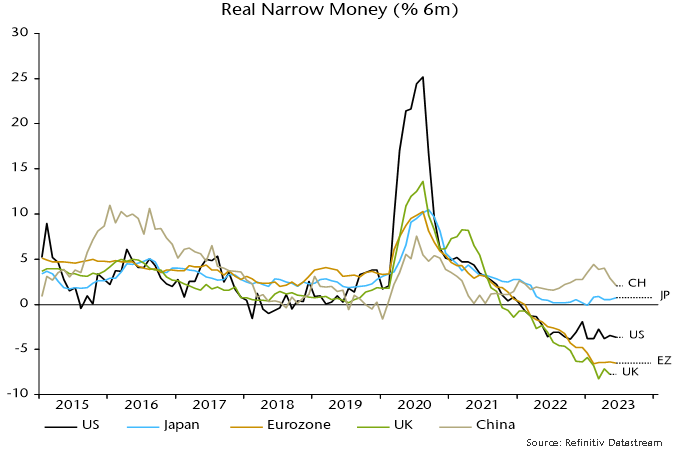
Chart 4
*Narrow money definition used here = M1A = currency + demand deposits.
 View Printer Friendly Version
 Email Article to Friend
Reader Comments (1)
Mixed because data from some regions will probably be revised quite negatively later? Combined with the fact that there is usually a 2 or 3 quarter lag from recession start to serious labour market declines?
US NSA continuing claims in 2008 didn't rise 30% y/y until well in to H2 and they've already hit that level earlier in July.
Ultimately we'll probably (seriously) regret not making more noise to stop central banks from continuing to raise rates even after recession most probably already started in the present cycle