
A "monetarist" perspective on current equity markets
 Simon Ward
 1 Comment
The money and cycles forecasting approach suggested that global inflation would fall rapidly during 2023 but at the expense of significant economic weakness. The inflation forecast played out but activity proved more resilient than expected. What are the implications for the coming year?
One school of thought is that economic resilience will limit further inflation progress, resulting in central banks disappointing end-2023 market expectations for rate cuts, with negative implications for growth prospects for late 2024 / 2025.
A second scenario, favoured here, is that the economic impact of monetary tightening has been delayed rather than avoided, and a further inflation fall during H1 2024 will be accompanied by significant activity and labour market weakness, with corresponding underperformance of cyclical assets.
The dominant market view, by contrast, is that further inflation progress will allow central banks to ease pre-emptively and sufficiently to avoid material near-term weakness and lay the foundation for economic acceleration into 2025.
On the analysis here, the second scenario might warrant a two-thirds probability weighting versus one-sixth for the first and third. This assessment reflects several considerations.
First, on inflation, developments continue to play out in line with the simplistic “monetarist” proposition of a two-year lead from money to prices. G7 annual broad money growth formed a double top between June 2020 and February 2021 – mid-point October 2020 – and declined rapidly thereafter. Annual CPI inflation peaked in October 2022, falling by 60% by November 2023 – chart 1.
Chart 1
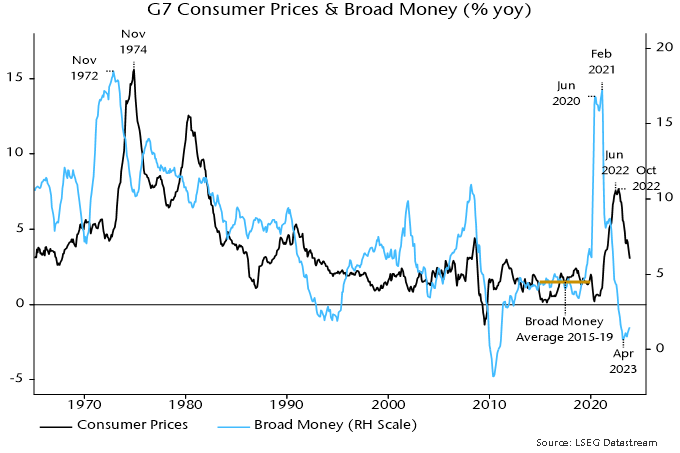
Broad money growth returned to its pre-pandemic average in mid-2022 and continued to decline into early 2023. The suggestion is that inflation rates will return to targets by H2 2024 with a subsequent undershoot and no sustained revival before mid-2025.
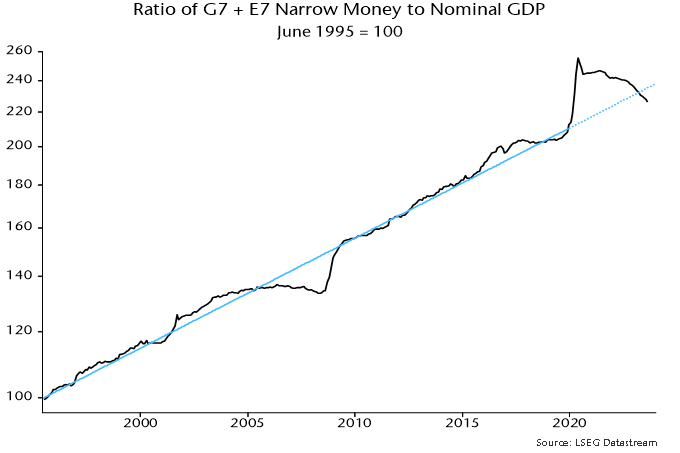
Secondly, economic resilience in 2023 partly reflected post-pandemic demand / supply catch-up effects. On the demand side, an analytical mistake here was to downplay the supportive potential of an overhang of “excess” money balances following the 2020-21 monetary explosion. Globally, this excess stock has probably now been eliminated – chart 2.
Chart 2
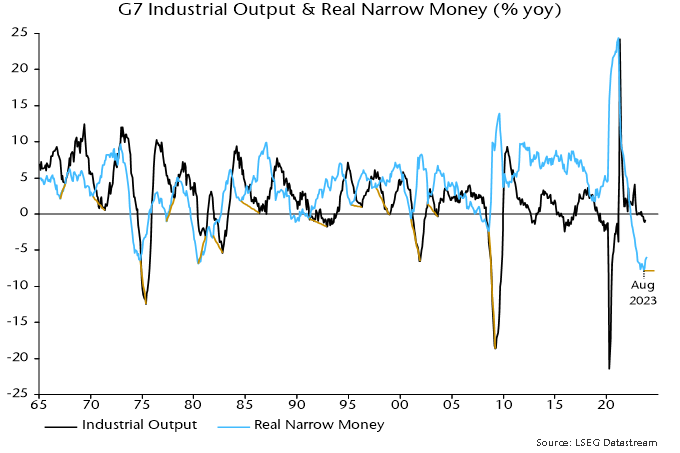
The moderate economic impact of monetary tightening to date, moreover, is consistent with historical experience. Major lows in G7 annual real narrow money momentum led lows in industrial output momentum by an average 12 months historically – chart 3. With a trough in the former reached as recently as August 2023, economic fall-out may not be fully apparent until H2 2024.
Chart 3
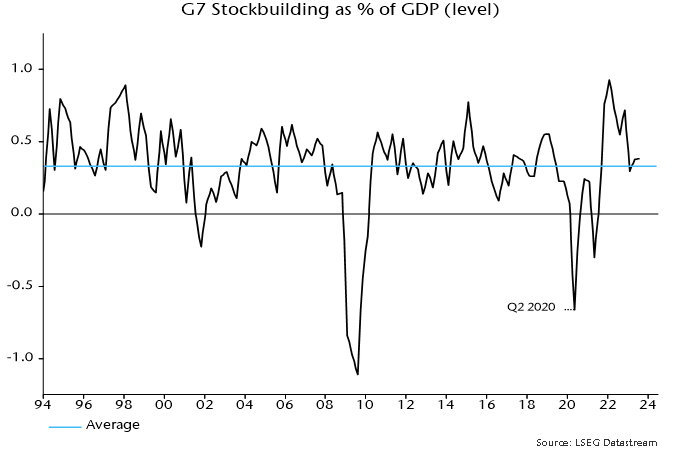
The suggestion that economic downside is incomplete is supported by a revised assessment of cyclical influences. The previous hypothesis here was that the global stockbuilding cycle would bottom out in late 2023 and recover during 2024. Recent stockbuilding data, however, appear to signal that the cycle has extended, with a recovery pushed back until H2 2024.
The assumption of a late 2023 trough was based on a previous low in Q2 2020 and the average historical cycle length of 3 1/3 years. This seemed on track at mid-2023: G7 stockbuilding had crossed below its long-run average in Q1, consistent with a trough-compatible level being reached in H2 – chart 4. The downswing, however, was interrupted in Q2 / Q3, with a further decline likely to be necessary to complete the cycle and form the basis for a recovery.
Chart 4
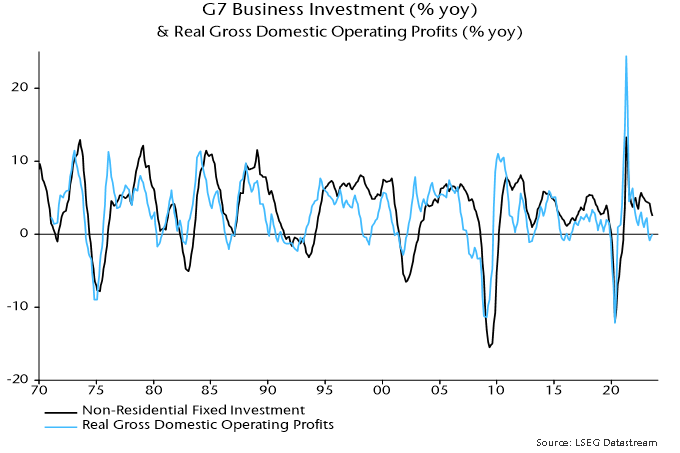
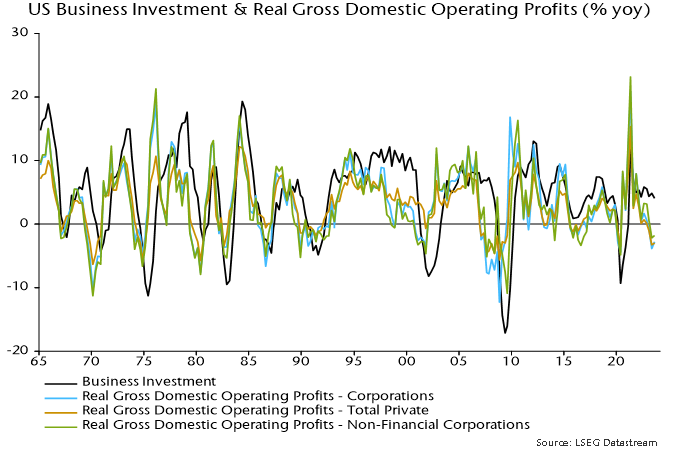
A resumed drag from stockbuilding may be accompanied by a further slowdown or outright weakness in business investment, reflecting recent stagnation in real profits – chart 5. Capex is closely correlated with hiring decisions, so this also argues for a faster loosening of labour market conditions.
Chart 5
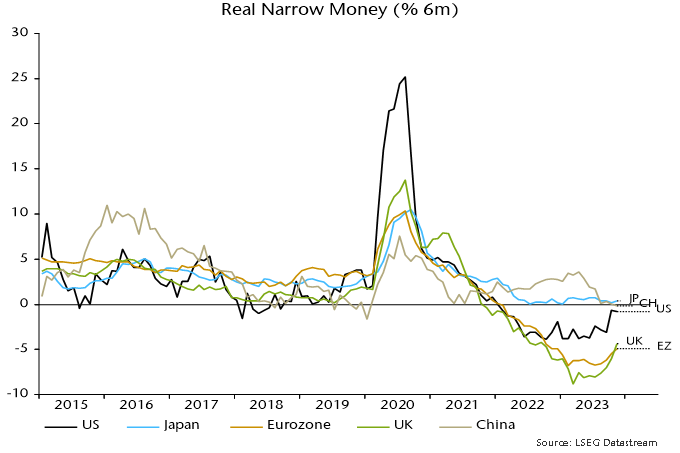
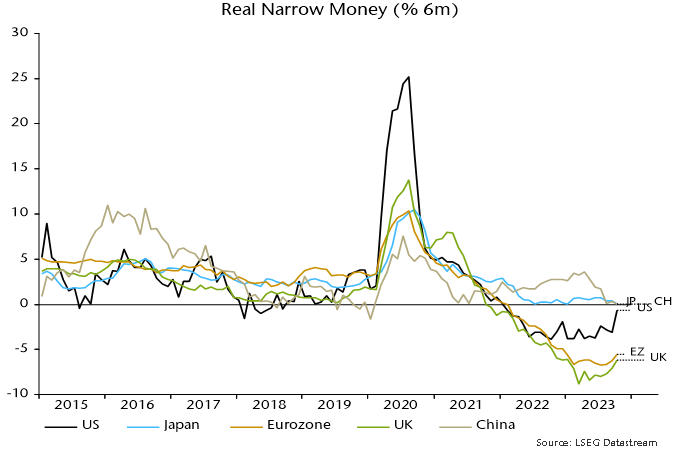
Real narrow money momentum remains weaker in Europe than the US, suggesting continued economic underperformance and a more urgent need for policy relaxation – chart 6. Six-month rates of change are off the lows but need to rise significantly to warrant H2 recovery hopes. Globally, the US / European revivals have been partly offset by a further slowdown in China, suggesting still-weakening economic prospects.
Chart 6
The frenetic rally of the final two months resulted in global equities delivering a strong return during 2023 despite the two “excess” money indicators tracked here* remaining negative throughout the year. The indicators, however, started flashing red around end-2021, since when the MSCI World index has slightly underperformed US dollar cash.
Historically (i.e. since 1970), equities outperformed cash on average only when both indicators were positive, a condition unlikely to be met until mid-2024 at the earliest.
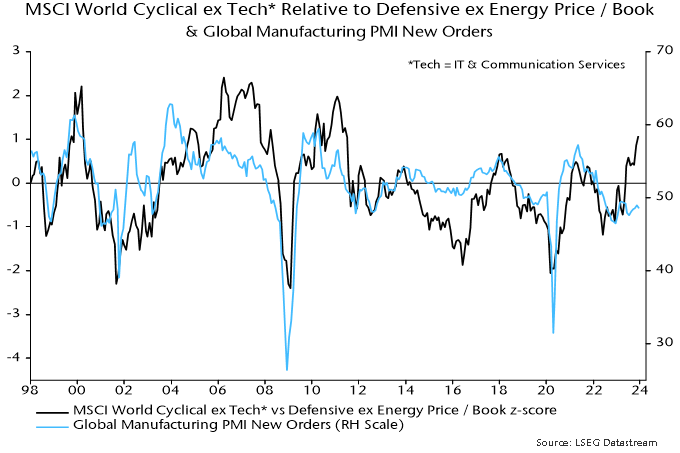
The late 2023 rally was led by cyclical sectors as investors embraced a “soft landing” scenario. Non-tech cyclical sectors ended the year more than one standard deviation expensive relative to history versus defensive ex. energy sectors on a price / book basis – chart 7. Current prices appear to discount an early / strong PMI recovery, which the earlier discussion suggests is unlikely.
Chart 7
Quality stocks outperformed during 2023, reversing a relative loss in 2022 and consistent with the historical tendency when “excess” money readings were negative. Earlier underperformance partly reflected an inverse correlation with Treasury yields, a relationship now suggesting further catch-up potential.
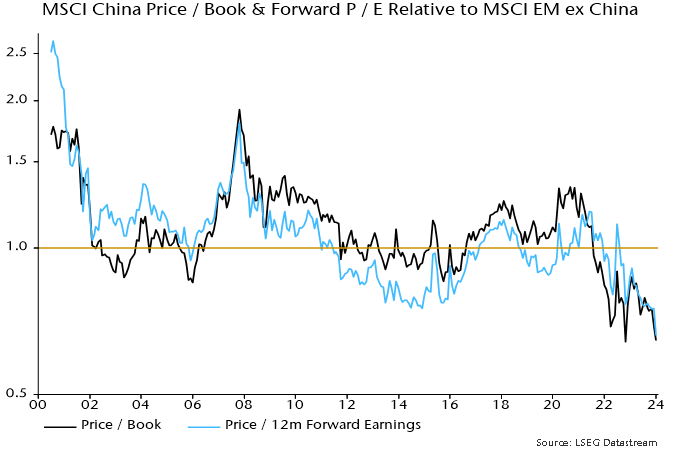
Contributing factors to the dramatic underperformance of Chinese stocks during 2023 include excessively optimistic post-reopening economic expectations at end-2022 and unexpectedly restrictive monetary / fiscal policies. MSCI China is at a record** valuation discount to the rest of EM – chart 8 – while monetary / economic weakness suggests an early policy pivot.
Chart 8
A key issue for 2024 is the extent to which central bank policy easing will revive money growth. While inflation is expected to trend lower into early 2025, the cycles framework suggests another upswing later this decade – the 54-year Kondratyev price / inflation cycle last peaked in 1974. Aggressive Fed easing 54 years ago – in 1970 – pushed annual broad money growth into double-digits the following year, creating the conditions for the final Kondratyev ascent. Signs that a similar scenario is playing out would warrant adding to inflation hedges.
*The differential between G7 plus E7 six-month real narrow money and industrial output momentum and the deviation of 12-month real narrow money momentum from a long-term moving average.
**Since June 2000. MSCI China included only B-shares through May 2000, when red chips and H-shares were added.
UK inflation: "monetarist" forecast on track
The MPC’s November inflation projections are ancient history. Price pressures have plunged in line with a simplistic monetarist forecast suggesting a return to target in Q2 2024 and an undershoot in H2.
The simplistic forecast is based on the Friedmanite rule that inflation directionally follows money growth with an average lag of two years. This is converted to a numerical profile by assuming a one-for-one relationship of deviations in inflation and money growth from 2% and 4.5% respectively.
Friedman emphasised the variability of the money growth / inflation lag but a two-year assumption has proved accurate in timing the inflation peak and subsequent decline – see chart 1.
Chart 1
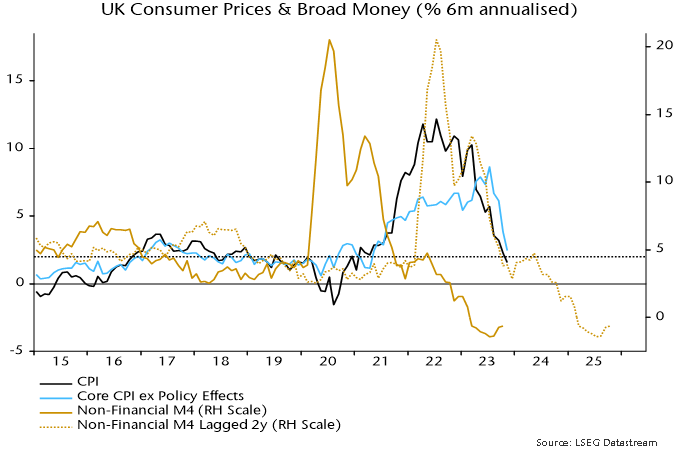
A post in July suggested that the six-month rate of increase in the CPI, seasonally adjusted, would fall to 2% annualised or lower around end-2023, reflecting a decline in six-month broad money growth to below 4.5% annualised in Q4 2021. The fall is ahead of schedule, with the six-month CPI increase at 1.6% in November.
The simplistic forecast suggests that six-month inflation will fluctuate around the current level through mid-2024 before dropping further in H2 – chart 1. The implication is that the annual rate will return to target in Q2 and undershoot during H2.
By contrast, the modal forecast for annual inflation in Q4 2024 in the November Monetary Policy Report was 3.1%, with the mean forecast (incorporating an upside risk assessment) at 3.4%.
Broad money momentum remains negative, suggesting that an inflation revival is unlikely before mid-2025.
Bottom-up considerations support the view that annual inflation will return to target by next spring, assuming no adverse shocks:
-
Annual inflation of food, alcohol and tobacco of 9.4% in November could fall to 3% by Q2. Annual producer output price inflation of food, beverages and tobacco is already down to 2.1%, while input prices of home-produced food are falling year-on-year.
-
The energy price cap will rise by 5% in January but Cornwall Insight currently projects a 14% cut in April.
-
Annual core goods inflation of 3.3% in November could fall to 1%. Core producer output prices are flatlining, while base effects are favourable through May.
-
Slowing food prices will feed through to catering services, with the historical sensitivity suggesting a fall in annual inflation from 7.8% in November to 4.5%. This would cut services inflation by 0.75 pp, based on the 23% weight of catering in the services basket.
-
The above two assumptions coupled with a 1 pp slowdown in the rest of the services basket would imply a 1.75 pp fall in annual core inflation by Q2 (5.1% in November). This would be sufficient to generate a 2% headline rate given the assumed food slowdown and a large year-on-year decline household energy bills.
US business money diverging positively from weak Europe
Recent US / European monetary weakness gives a negative signal for economic prospects through mid-2024, at least. US trends, however, are showing signs of improvement in aggregate and in terms of sectoral developments, suggesting smaller downside risk and earlier recovery prospects.
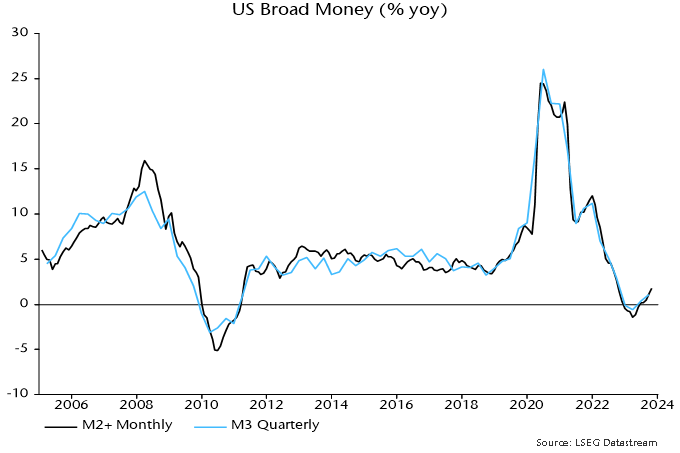
The monthly measure of US broad money tracked here adds commercial bank large time deposits and institutional money funds to the Fed’s M2 aggregate (“M2+”). The former items are important for capturing corporate and institutional money holdings.
The monthly aggregate can be cross-checked against a quarterly M3 measure derived from the Fed’s financial accounts, which additionally includes repurchase agreements. Annual rates of change of the two measures bottomed in March and have recovered to weak positive territory (1.8% for M2+ in October, 1.1% for M3 in September) – see chart 1.
Chart 1
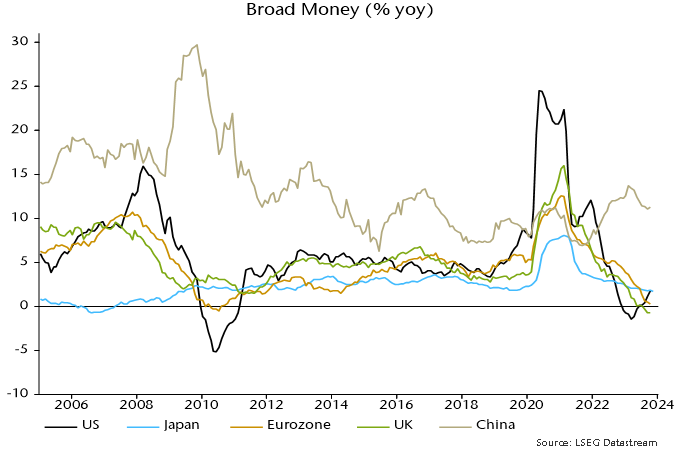
This recovery contrasts with a further decline in annual rates of change of Eurozone and UK broad money, as measured by non-financial M3 and non-financial M4 respectively. The UK series crossed below the US level in July, with the Eurozone following in September – chart 2.
Chart 2
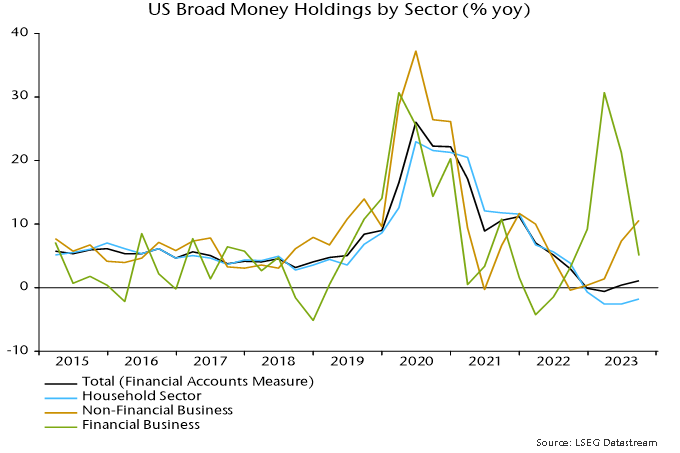
The suggestion that US economic prospects for later in 2024 are less bad than in Europe and improving at the margin is supported by sectoral money developments. Aggregate money is the best guide to economic prospects but changes in business / corporate liquidity usually carry more significance than fluctuations in household money holdings, reflecting their influence on decisions about investment and hiring.
The sectoral M3 breakdown in the Fed’s financial accounts shows that still-weak aggregate broad money growth is explained by a continued fall in the household component, while money holdings of non-financial businesses have bounced back, rising by 10.6% in the year to September – chart 3*.
Chart 3
By contrast, annual rates of change of money holdings of Eurozone / UK non-financial corporations remain negative, with no sign of recovery – chart 4.
Chart 4
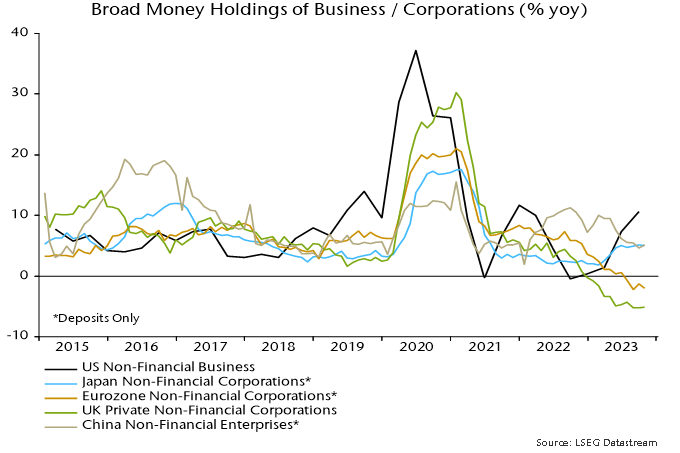
The pick-up in US business money holdings is surprising and may not be sustained but current US / European monetary divergence suggests that US economic outperformance will continue, while a reversal of policy tightening is more urgently required in the Eurozone / UK.
*The pick-up in business money is not fully captured by M2 (because much of the inflow has been into large time deposits and institutional money funds), explaining why M2 is lagging M2+ / M3, falling by 3.3% in the year to October (versus 1.8% growth of M2+).
Questioning US economic "strength"
The 5.2% annualised increase in the headline expenditure-based measure of US GDP in Q3 partly represents payback for earlier weakness. GDP has risen at a modest 1.7% annualised pace since end-2021, well below average expansion of 2.5% in the five years preceding the pandemic (i.e. to end-2019).
The alternative income-based measure of GDP – gross domestic income – paints a much more miserable picture. GDI grew by 1.7% annualised in Q3 alone and by only 0.4% in the seven quarters since end-2021 – see chart 1.
Chart 1
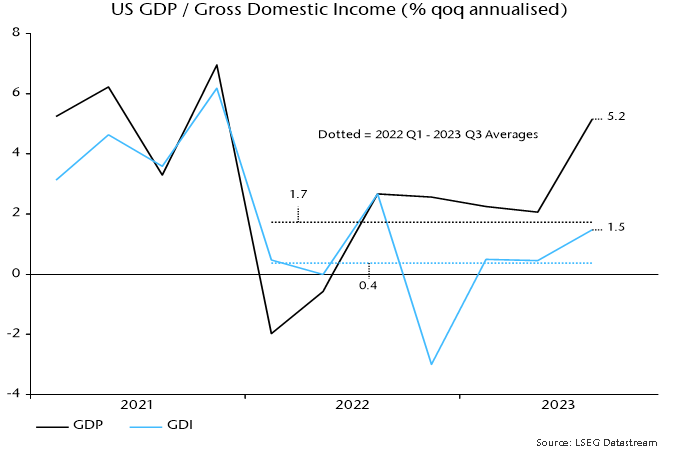
It has been suggested that the GDP / GDI divergence is capturing an increased reliance on borrowing and / or savings depletion to finance spending. This is incorrect: GDP and GDI measure the same concept and the divergence reflects a rising statistical discrepancy, with GDP 2.6% higher than GDI in Q3.
The higher level of GDP does not imply that the GDI measure is less inclusive or accurate. Research by Jeremy Nalewaik, then a Fed economist, found that early GDI estimates were a better gauge of cyclical fluctuations and predicted the direction of future revisions to GDP.
If the national accounts evidence suggests lacklustre performance at best, what explains the consensus perception of US economic “strength”?
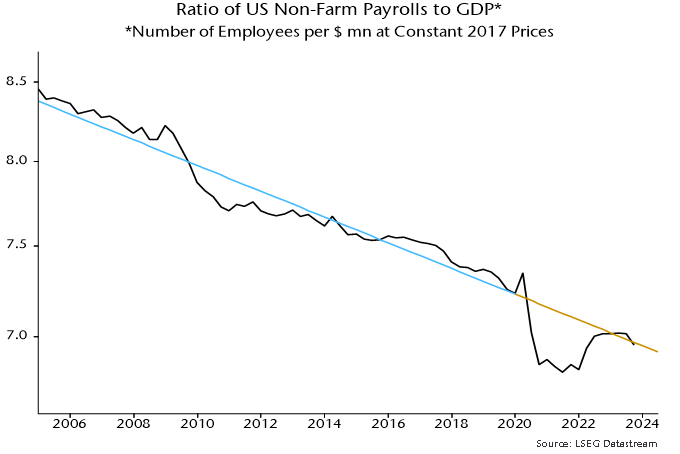
The answer seems to be unusually rapid growth of payroll employment. Payrolls rose at a 2.8% annualised rate between Q4 2021 and Q3, significantly outpacing GDP expansion of 1.7%.
Payrolls strength is judged here to reflect a normalisation of the relationship with the level of GDP, following an undershoot of trend during the pandemic – chart 2. This adjustment appears complete, implying that payrolls will lag GDP going forward (the slope of the trend line implies an annualised growth shortfall of 1.0%).
Chart 2
The GDP / GDI contrast is particularly stark over the latest four quarters, during which GDP grew by 3.0% but GDI contracted by 0.2%.
The table below shows the contributions of GDI components to its change over the past year. With real wage income growing solidly, GDI contraction was attributable to falls in real operating profits of corporations and other private enterprises.

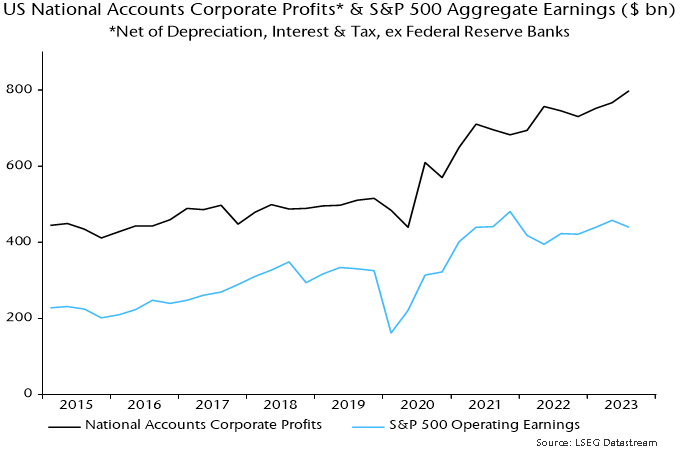
Is national accounts profits weakness consistent with company earnings data? GDI operating profits are gross of depreciation, interest and taxes and exclude foreign earnings, so adjustments are necessary to align with S&P 500 earnings. Chart 3 compares nominal data for S&P 500 aggregate operating earnings and an equivalent national accounts-based measure for corporations excluding the Fed. S&P earnings grew more slowly in the year to Q3, so there is no suggestion of a negative discrepancy in the national accounts numbers.
Chart 3
Real operating profits are a leading indicator of business investment so the contraction in recent quarters suggests a capex downturn ahead – chart 4.
Chart 4
Global monetary update: respect the lags
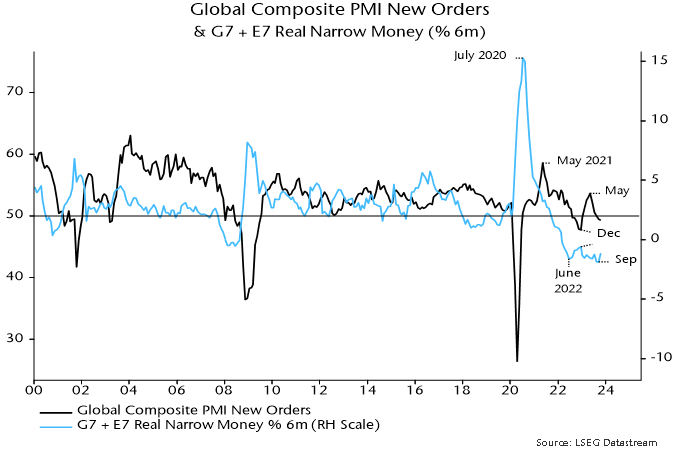
Global six-month real narrow money momentum – a key leading indicator in the forecasting approach employed here – is estimated to have rebounded in October, having reached a new low in September. Allowing for an average 6-7 month lead, this suggests that the global composite PMI new orders index will decline into end-Q1 2024 but may stabilise in Q2 if September is confirmed as a low for real money momentum – see chart 1.
Chart 1
One reason for thinking that September may have marked a low is that six-month consumer price momentum is likely to slow into Q1, based on current commodity prices.
In addition, six-month nominal narrow money momentum in the US, Eurozone and UK, while still very weak, appears to have bottomed, although a significant recovery is unlikely until central banks start easing.
As previously discussed, the main driver of the further fall in global real money momentum into September was a sharp slowdown in China. A hope here that the PBoC would expand liquidity supply to lower elevated money market rates has yet to be realised, suggesting that money trends will remain weak into early 2024. (The PBoC’s Q3 monetary policy report is worrying in this regard, apparently signalling a reduced emphasis on adjusting policy in response to strength or weakness in money and credit.)
Among the major economies, six-month real narrow money momentum has recovered most in the US, although even here remains negative – chart 2.
Chart 2
This recovery suggests less bad US economic prospects for later in 2024 but should not be interpreted as implying a reduced probability of a near-term hard landing / recession.
As chart 3 shows, it has been normal historically for six-month real narrow money momentum to start recovering before a recession hits or during its early onset.
Chart 3
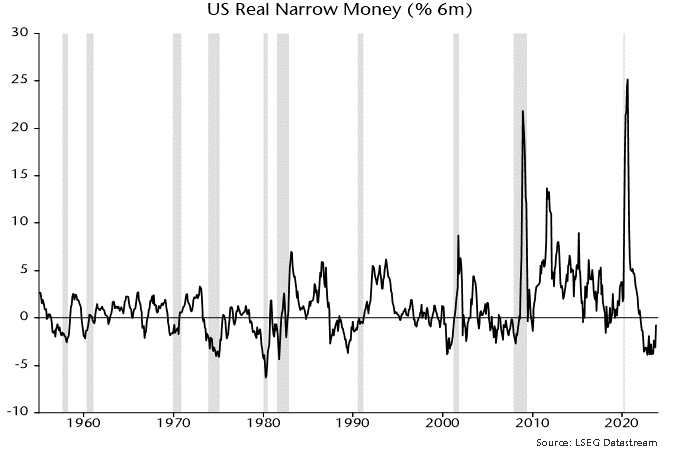
One explanation for this relationship is that recessions are triggered by a sudden switch from spending to saving, with the latter reflected in an accumulation of liquid assets. A reversal of such “hoarding” in response to policy easing is a key driver of an eventual recovery.
So a further US monetary revival could confirm an unfolding hard landing as well as laying the foundation for economic recuperation six to 12 months ahead.