
Why UK inflation underperformance could be ending
 Simon Ward
 1 Comment
UK headline CPI momentum continues to track a simplistic “monetarist” forecast based on the profile of broad money momentum two years earlier.
Six-month growth of headline prices, seasonally adjusted, peaked at 12.7% annualised in July 2022 and had halved to 6.5% as of June. This mirrors a halving of six-month broad money momentum from a peak of 20.5% annualised in July 2020 to 10.5% in June 2021 – see chart 1.
Chart 1
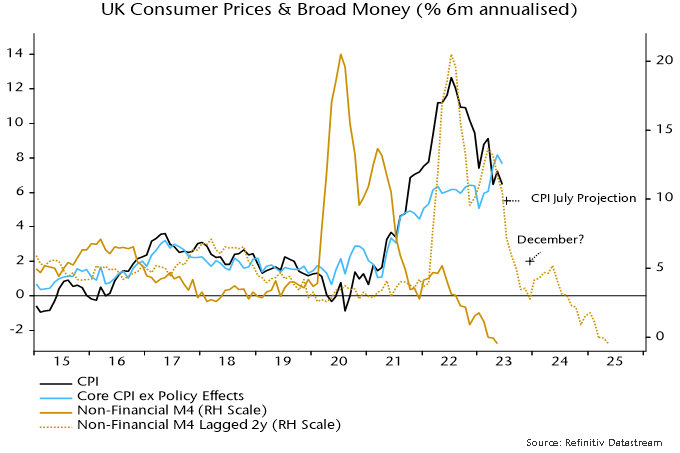
Broad money continued to slow sharply during H2 2021, with six-month momentum down to 2.7% by December, suggesting a fall in six-month CPI momentum to 2% annualised or lower by late 2023 / early 2024.
A 2% rate of increase of prices during H2 2023 could be achieved by the following combination:
The energy price cap falling by a further 10% in October, in line with current estimates based on wholesale prices, following the 17% July reduction.
Food, alcohol and tobacco prices slowing to an 8% annual inflation rate by December from 14.9% in June.
Core prices rising at a 4% seasonally adjusted annualised rate during H2 2023, down from 7.7% in H1.
The latter two possibilities are supported by producer output price developments – annual inflation of food products is already down from a 16.8% peak to 8.7%, while core output prices flatlined during H1, following a 6.4% annualised rise during H2 2022.
A 2% annualised CPI increase during H2 2023 would imply a headline annual rate of about 4% by year-end, well with PM Sunak’s target of a halving from 10%+ levels, although he will have made no contribution to the “success”.
Why has UK CPI inflation exceeded US / Eurozone levels, both recently and cumulatively since end-2019?
The assessment here is that the divergence reflects relatively weak UK supply-side economic performance and a larger negative terms of trade effect, rather than more egregious monetary excess.
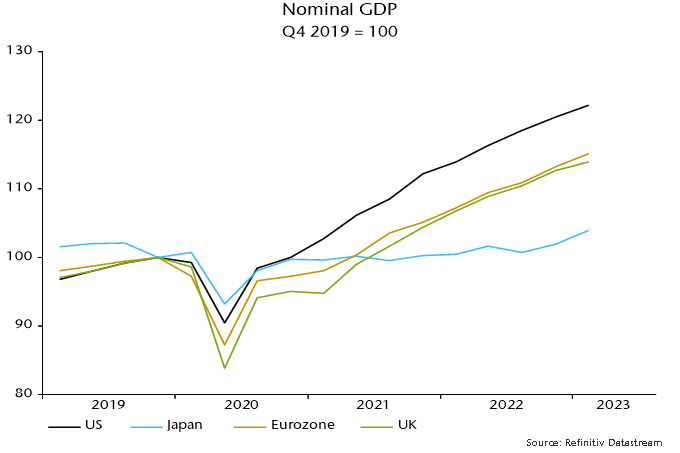
Charts 2 and 3 show that UK / Eurozone broad money expansion since end-2019 has been similar and less than in the US, with the relative movements mirrored in nominal GDP outcomes.
Chart 2
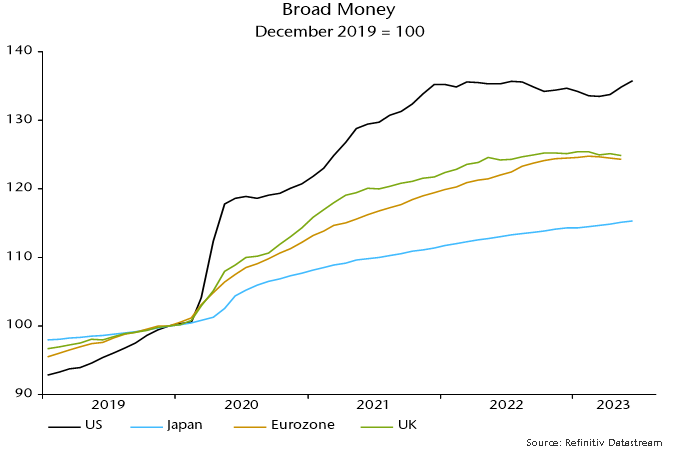
Chart 3
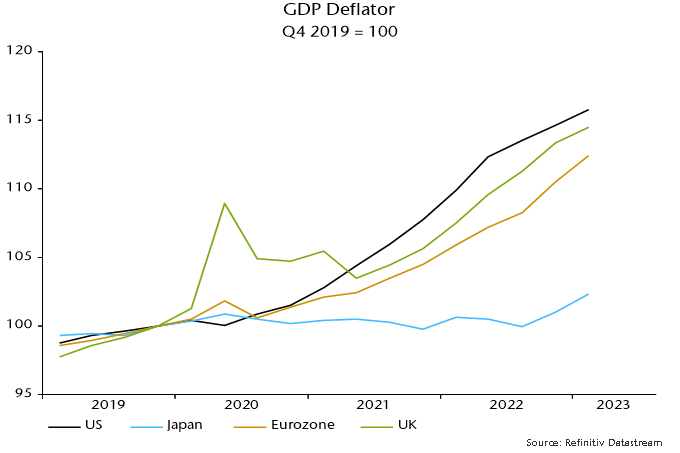
The UK has, however, underperformed the US and Eurozone in terms of the division of nominal GDP expansion between real GDP and domestically-generated inflation, as measured by the GDP deflator – charts 4 and 5.
Chart 4
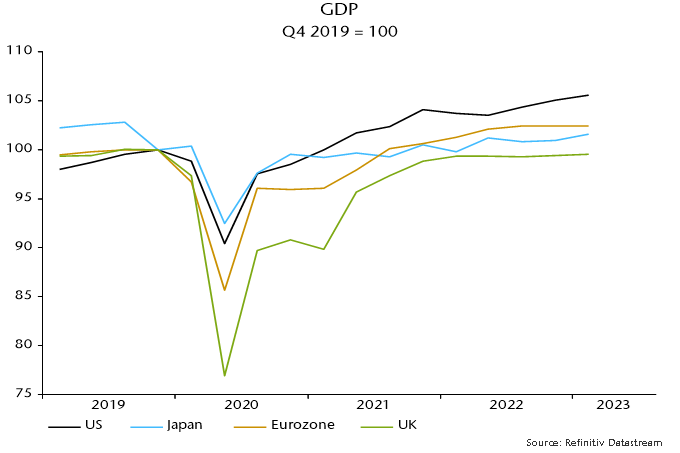
Chart 5
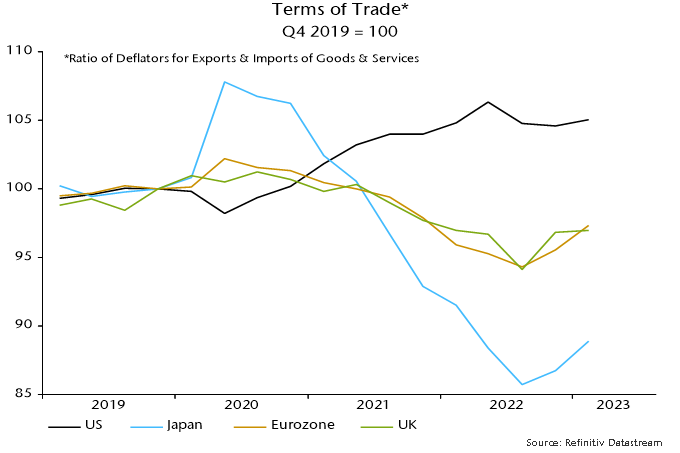
UK consumer prices were additionally boosted relative to the US by opposite movements in the terms of trade (i.e. the ratio of export to import prices), reflecting different exposures to energy prices as well as currency movements (i.e. a strong dollar through last autumn) – chart 6.
Chart 6
UK supply-side weakness may be structural but monetary and terms of trade considerations suggest an improvement in UK relative inflation performance – annual broad money growth is now similar to the US and below the Eurozone level, while sterling appreciation since late 2022 may extend a recent recovery in the terms of trade.
 View Printer Friendly Version
 Email Article to Friend
Reader Comments (1)
I think we need to be careful comparing different countries CPI within small margins at relatively high absolute level.
A couple of % can be accounted for by different methodology or a slightly different CPI basket.