
Inflation lessons from the 1970s
 Simon Ward
 4 Comments
Why did high inflation become entrenched in the 1970s?
The consensus view is that an initial inflation shock became embedded in expectations, resulting in inflationary price- and wage-setting behaviour.
The “monetarist” view is that the underlying driver was sustained high money growth, which played a key role in allowing inflation expectations to become dislodged.
A surge in G7 annual broad money growth to a peak in November 1972 was followed by a surge in annual CPI inflation to a peak two years later – see chart 1.
Chart 1
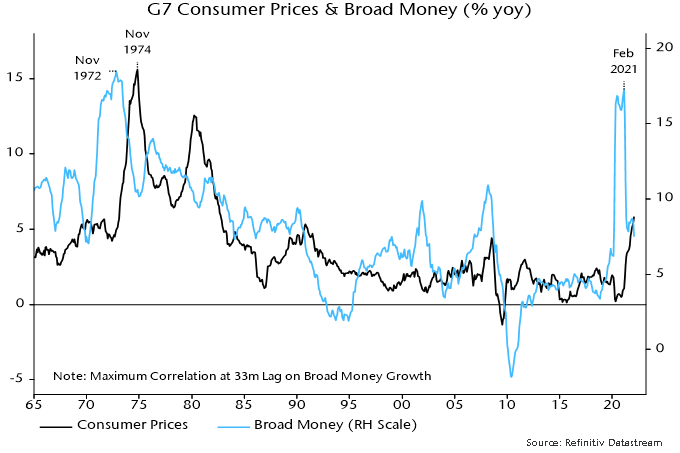
Broad money growth showed a similar surge to an initial peak in June 2020 and CPI inflation may top out in mid-2022. The ultimate peak in money growth was in February 2021, suggesting that inflation will remain high into 2023.
Monetary authorities responded to the 1973-74 inflation surge by tightening policy aggressively – see chart 2, which overlays a weighted average of G7 short-term interest rates. They had ignored the inflationary warning from money trends but displayed Volcker-esque zeal in attempting to correct their mistake.
Chart 2
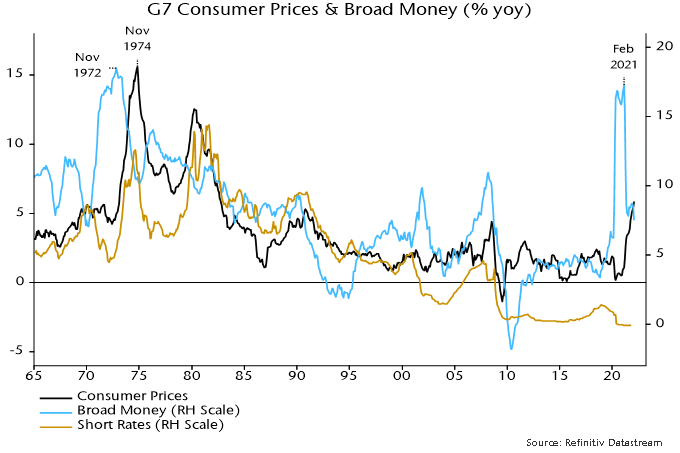
Policy tightening resulted in a major monetary slowdown over 1973-75. With inflation continuing to surge, real money balances plunged and economies moved into recession.
The critical policy error occurred at this point. While money growth had fallen significantly, it remained high by historical standards and inconsistent with a full reversal of the inflation rise. Yet policy-makers performed another U-turn as recession unfolded, cutting interest rates as aggressively as they had raised them.
The result was that G7 broad money growth bottomed out above 10% in early 1975 and rebounded into 1976. Short rates were held at their lower level despite persistent high inflation and money growth remained above 10% until 1979.
What are the lessons for today?
While rate rises are only beginning, the view here is that there has already been a major “tightening” of policy in the form of the cessation of QE and shift to hawkish forward guidance. In the US, this is captured by a 210 bp rise in the Wu-Xia shadow fed funds rate between November and February. (The corresponding UK shadow rate has risen by an astonishing 10.2 pp since January 2021).
Consistent with this interpretation, annual broad money growth fell to an estimated 7.5% in February, with the three-month annualised rate of increase down to 5%.
With CPI momentum still rising, real money balances are now contracting and recession risk has risen. The real money squeeze, however, is mild compared with 1974-75.
On current trends, the monetary backdrop will soon be compatible with an eventual return of inflation to targets, although possibly not until 2024.
Central banks face opposing risks. If they raise rates in line with expectations, monetary trends could weaken further, causing unnecessary economic damage and a medium-term undershoot of inflation targets.
If they back off, however, money growth could stage a 1975-style rebound at a time when inflationary expectations are showing signs of becoming “unanchored”.
The judgment here is that the former risk is much greater.
A key point is that high money growth in the 1970s reflected underlying strength in private sector credit demand. The 1974-75 rate cuts, therefore, resulted in a big rebound in bank lending expansion, which underpinned inflationary money growth – chart 3.
Chart 3
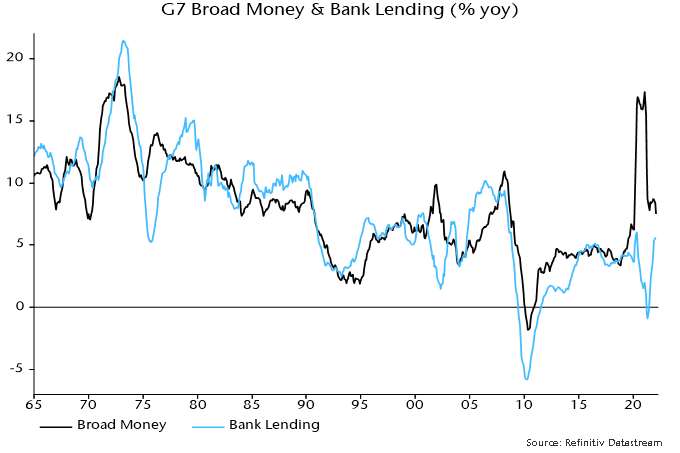
The 2020 surge in money growth, by contrast, was entirely due to QE (more precisely, monetary financing of fiscal deficits). Bank lending expansion has risen recently but is nowhere near the levels reached in the 1970s, or even the noughties.
The upshot is that money growth is unlikely to rebound strongly if central banks back off from rate rises – assuming no return to QE.
Policy-makers should monitor monetary trends and adjust their stance accordingly – in a dovish direction if the recent slowdown extends or hawkishly in the unlikely event of a reacceleration. Astonishingly, they continue to deny any linkage between the 2020 money growth surge and current inflation problems. Such denial is a recipe for more bad decision-making and 1970s-style economic volatility.
 View Printer Friendly Version
 Email Article to Friend
Reader Comments (4)
So probably a policy error or several of them incoming?
Hi Simon,
Where can I view the Wu-Xia equivalent for the UK? 10.2% tightening is an extraordinary move.
Thanks
Adam
Some analysts/strategists are also referring to the post WWII period. It would be interesting to learn your take on the similarities with and differences between that episode.
Hi Adam, Cynthia Wu publishes the data on her website:
https://sites.google.com/view/jingcynthiawu/shadow-rates