
Hard landing watch: full PMI results, OECD G7 leading indicator
 Simon Ward
 Post a Comment
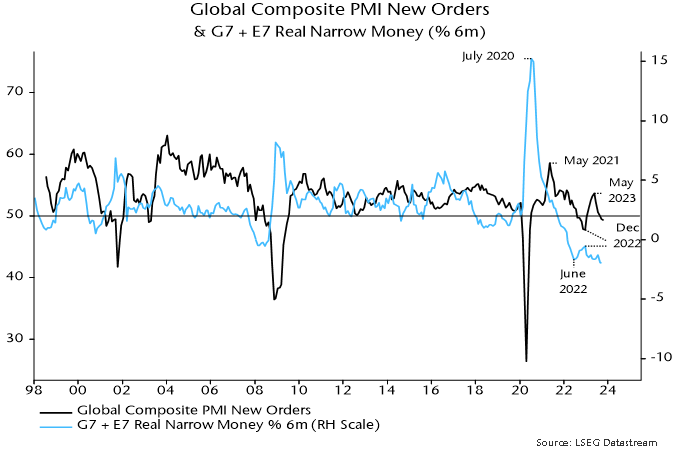
The global composite PMI new orders index fell from 49.5 in September to 49.3 in October, extending a decline from a local peak in May. Recent weakness was signalled by a fall in six-month real narrow money momentum, which reached a new low in September, suggesting a further PMI decline into end-Q1 – see chart 1.
Chart 1
The new orders index is 1 standard deviation below its historical average, consistent with slow global GDP expansion – chart 2.
Chart 2
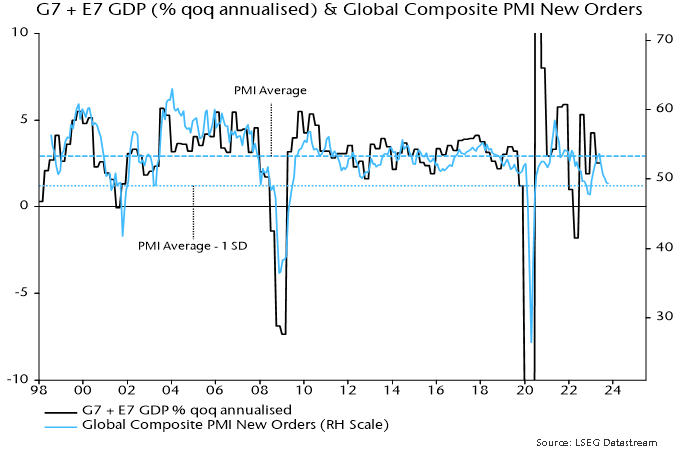
The index would need to fall to 46-47 to signal a full-blown global recession. The current level, however, is weak enough to suggest “hard landings” in selected economies. It is, for example, below the low reached in 2012 during the Eurozone recession / financial crisis.
The October fall in the index was again driven by services new business, with manufacturing new orders extending a minor recovery since July – chart 3.
Chart 3
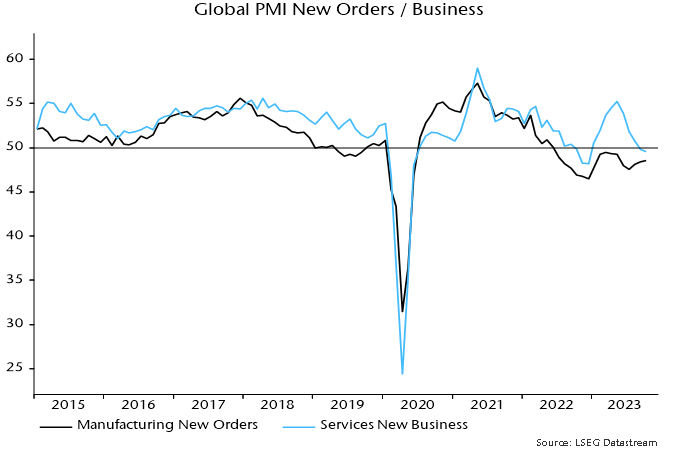
The suggestion here has been that manufacturing would receive support from a lessening of a drag from the stockbuilding cycle but a recovery was likely to prove modest and temporary, reflecting offsetting weakness in final demand.
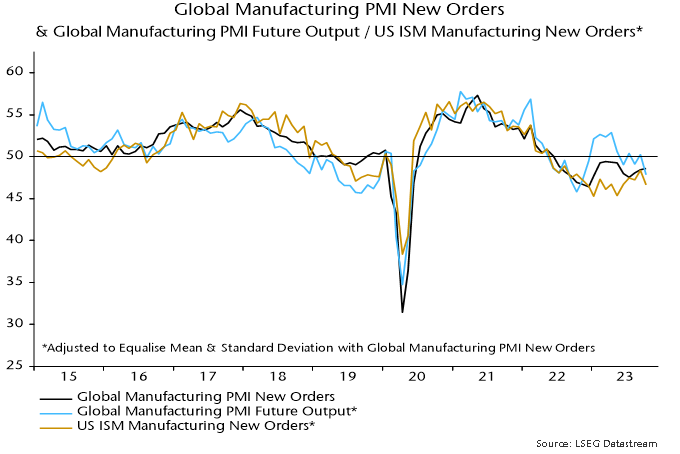
The small further rise in global manufacturing PMI new orders in October was not mirrored by output expectations or US ISM manufacturing new orders, both of which reversed lower – chart 4.
Chart 4
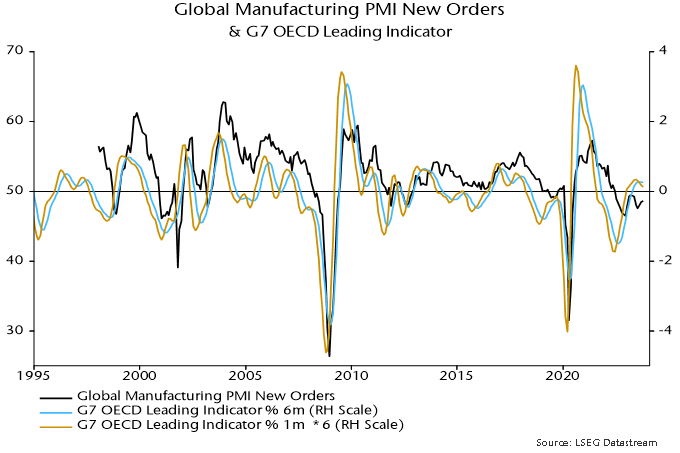
The possibility that manufacturing is on the brink of renewed weakness is tentatively supported by the OECD’s G7 leading indicator. The rate of change of the indicator* appears to be inflecting lower and has led peaks and troughs in global manufacturing PMI new orders historically – chart 5.
Chart 5
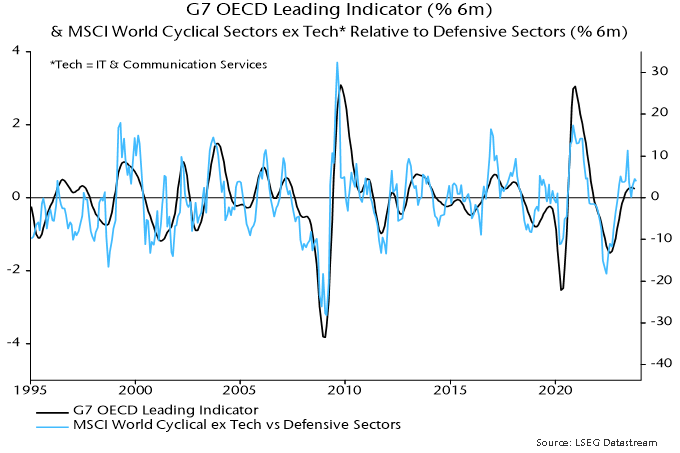
The above evidence casts doubt on last week’s strong rally in equity market cyclical sectors, apparently due to rising rate peak / soft landing hopes. The rate of change of the leading indicator has correlated with the relative performance of cyclical sectors historically, suggesting cyclical underperformance if the momentum reversal is confirmed – chart 6.
Chart 6
Verdict: consistent with developing hard landing.
*The indicator is calculated independently using the OECD's historical methodology, i.e. excluding a temporary reduction in data smoothing applied by statisticians in 2020 in response to the covid shock.
 View Printer Friendly Version
 Email Article to Friend
Reader Comments