
Equities / cash switching rule update
 Simon Ward
 Post a Comment
The "monetarist" equities / cash switching rule followed here recommends unhedged global equities (MSCI World index) only when the following two conditions are satisfied:
1. Six-month change in global (i.e. G7 plus E7*) real narrow money above six-month change in industrial output;
2. 12-month change in global real narrow money above slow moving average (currently at 5.6%).
The thinking is that fulfilment of the two conditions is likely to indicate that money holdings are growing faster than the demand for money to support economic activity, in turn suggesting that demand for financial assets, including equities, will increase, with associated upward pressure on prices.
The rule is applied at the end of each month and allows for data reporting lags – one month for real money and two months for industrial output.
The first chart compares the backtested cumulative return relative to Eurodollar deposits from following the rule with the return on equities (the horizontal sections represent periods when the rule was in cash).
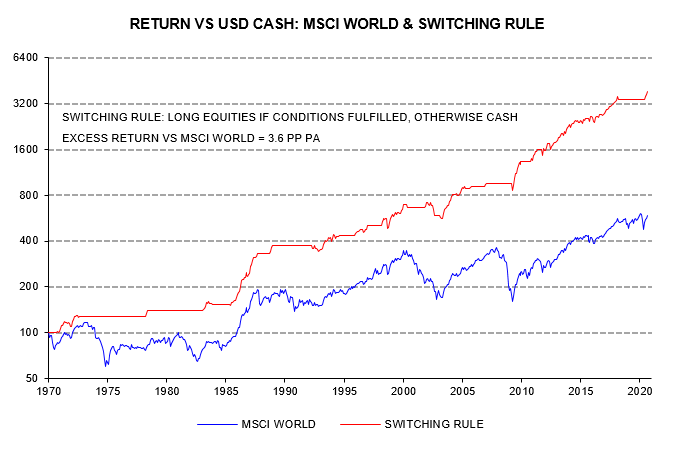
The rule was in cash at the start of 2020 because condition 2 was unmet. Global 12-month real narrow money growth crossed above the slow moving average in March, surging to 8.8% from 4.7% in February. Accounting for the one-month reporting lag, the rule switched into equities at end-April.
No judgement is applied in implementing the rule. Weekly US money data released on 2 April showed that annual narrow money growth had jumped from 6.2% in February to 17.0% in the week ending 23 March. Allowing for a US weight of 28%, this was a strong signal that the global 12-month real narrow money growth measure would cross above the moving average in March. The MSCI World index rose by 13.9% between 2 April and month-end, when the rule switched into equities.
12-month global real narrow money growth stood at 16.6% in June, far above the moving average. Condition 2 is likely to remain satisfied through H2 2020.
The six-month rate of change differential between global real narrow money and industrial output peaked at record 26.5 percentage points (pp) in April, narrowing to 20.8 pp in June as a V-shaped industrial recovery started to unfold – second chart.
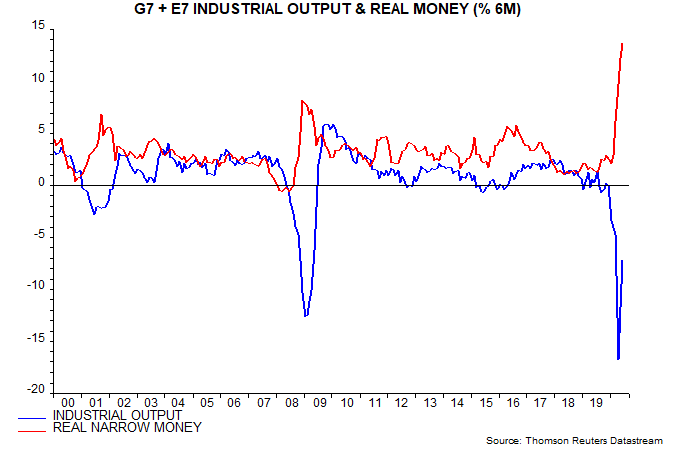
The monthly rise in global real narrow money has fallen from a March peak of 3.9% to 3.6% in April, 2.8% in May and 1.6% in June. Suppose that monthly growth is maintained at 1.6% while global industrial output rises at a constant rate to return to its December 2019 level in December 2020 – regarded here as a plausible scenario. On these assumptions the six-month rate of change differential between global real money and output would turn negative in October, causing the switching rule to recommended a move out of equities into cash at end-December.
Any such cross-over could prove short-lived – industrial output could slow sharply when a V recovery is complete while low rates and continued QE could sustain solid money growth.
As previously discussed, real Treasury yields are usually sensitive to changes in the real money / output growth differential. A rise in real yields over coming weeks would support the view that the monetary backdrop for equities is starting to become less favourable.
*G7 plus seven large emerging economies. G7-only data were used pre 2005.
 View Printer Friendly Version
 Email Article to Friend
Reader Comments