
Still looks like a "V"
 Simon Ward
 Post a Comment
The central view here remains that the global economy is staging a V-shaped recovery – or an italic V, at least – from the covid shock (not recession), with industrial output / GDP likely to regain pre-crisis levels in late 2020 / early 2021.
Most countries have now released June industrial output and retail sales data. Aggregate real retail sales in the G7 and seven large emerging economies are estimated to have matched the pre-crisis high reached in September 2019 – see first chart.
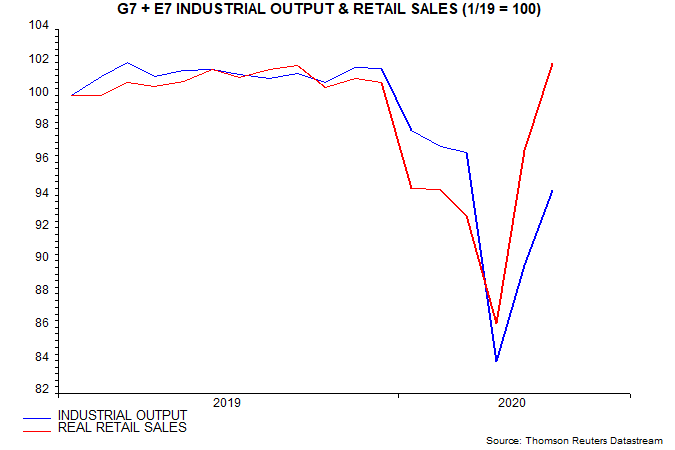
Industrial output rose by an estimated 5.1% following a 7.0% May increase and has now retraced 59% of the December-April decline.
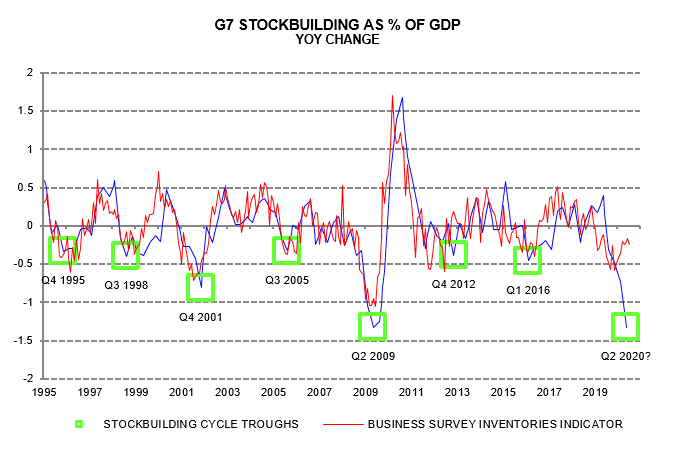
The stronger recovery in consumer goods demand than output appears to have been reflected in heavy Q2 destocking – second chart. Previous posts suggested that the stockbuilding cycle had bottomed in Q1, based partly on firms’ assessment of stock level adequacy, but covid production restrictions forced further involuntary inventory liquidation last quarter. Restocking should give a major boost to industrial output in H2, causing it to outpace / overshoot sales.
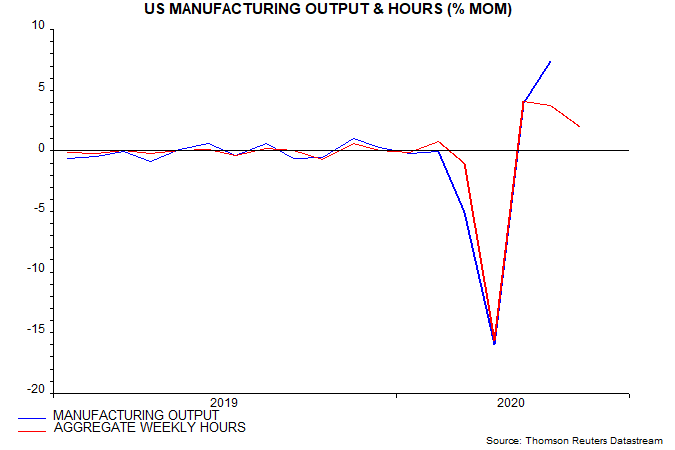
Global industrial output is likely to post another bumper rise in July. US aggregate manufacturing hours were up a further 2.0% last month – third chart.
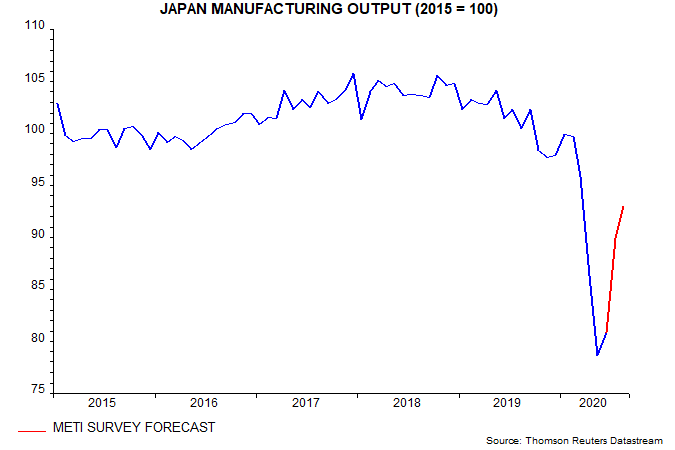
Japan has lagged the global recovery but manufacturers expect a 15.1% July-August output surge, according to METI – fourth chart.
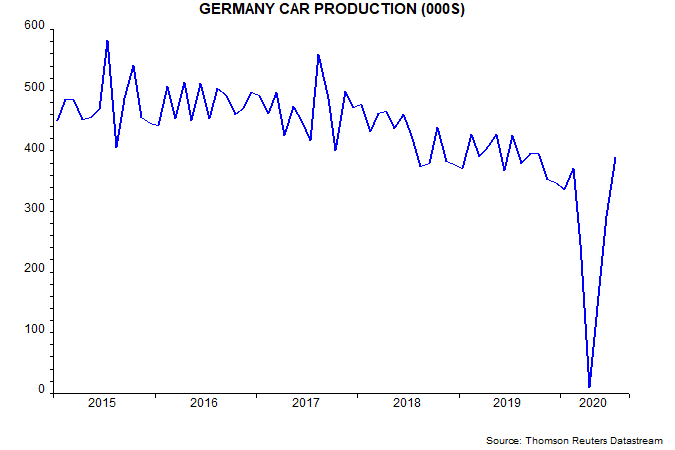
German car production, meanwhile, normalised in July – fifth chart.
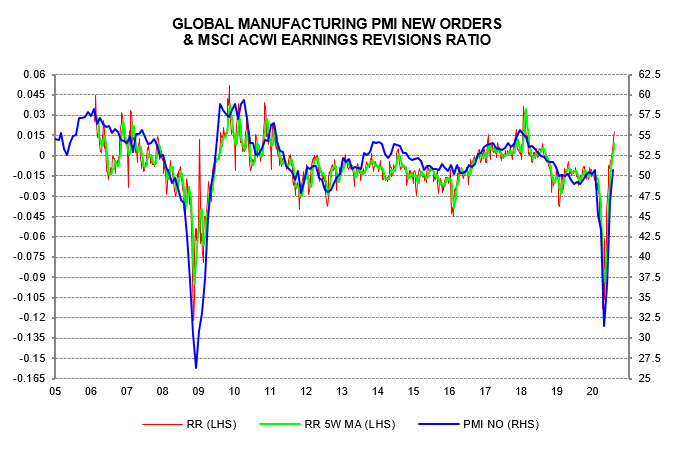
The global manufacturing PMI new orders index regained the 50 level in July, with the equity analysts’ earnings revisions ratio leading the move higher and suggesting a further rise to 55+ – sixth chart.
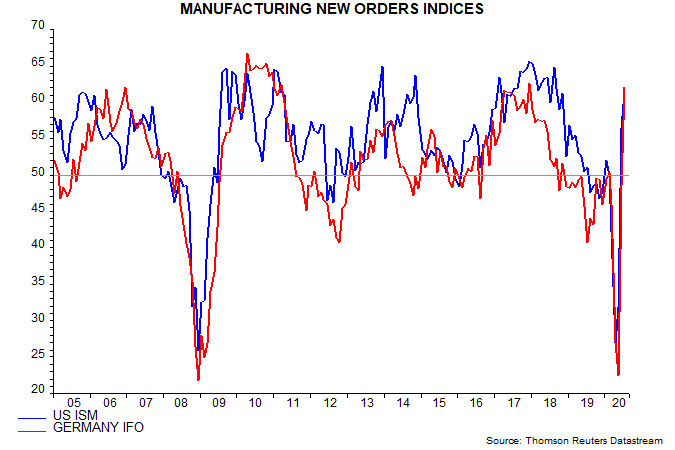
National manufacturing surveys are consistent with a further PMI gain: new orders indices in the US ISM and German Ifo surveys shot above 60 last month – seventh chart.
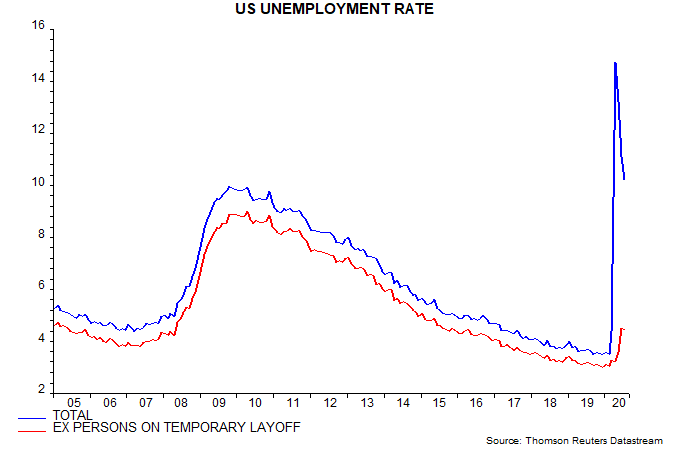
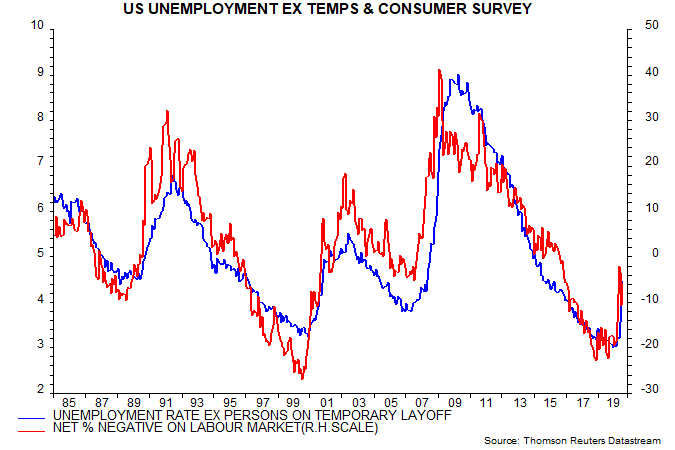
The recall of furloughed workers resulted in another larger than expected decline in US unemployment in July, with the "permanent" rate, excluding temporary layoffs, encouragingly stable at 4.4%, below a long-run average (since 1985) of 5.1% – eighth chart.
The suggestion that labour market damage has been contained is supported by the Conference Board consumer survey, showing negativity about job availability and prospects similarly below the long-run average – final chart.
 View Printer Friendly Version
 Email Article to Friend
Reader Comments