More negative monetary news
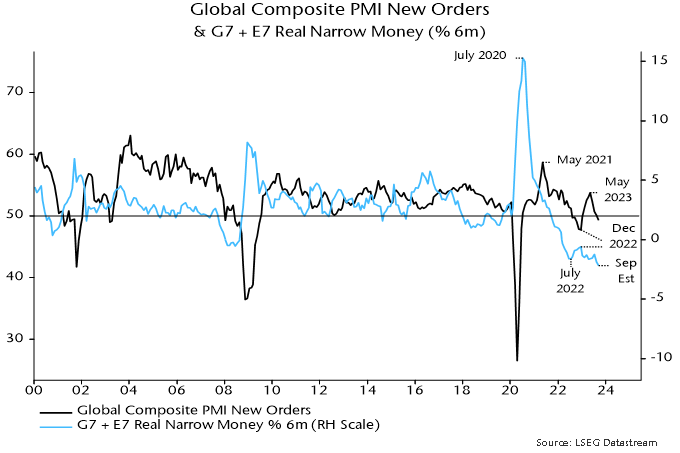
Global six-month real narrow money momentum – a key leading indicator in the forecasting approach employed here – is estimated to have fallen to another new low in September. Real money momentum has led turning points in global PMI new orders by an average 6-7 months historically, so the suggestion is that a recent PMI slide will extend through end-Q1 – see chart 1.
Chart 1

The September real narrow money estimate is based on monetary data for countries with a two-thirds weight in the global (i.e. G7 plus E7) aggregate and CPI data for a higher proportion.
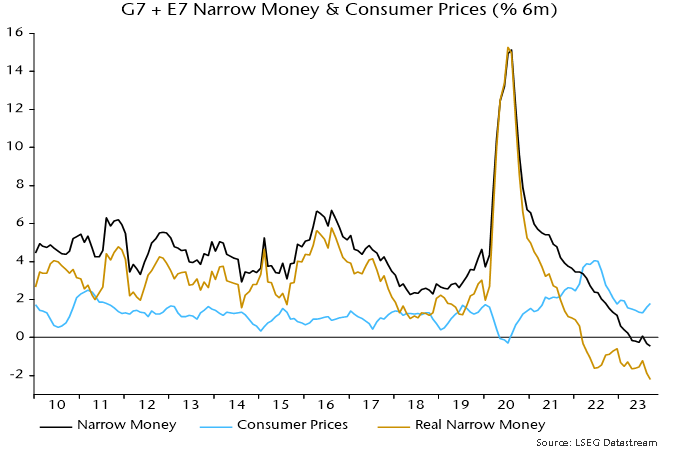
The estimated September fall reflects additional nominal money weakness coupled with a further oil-price-driven recovery in six-month CPI momentum – chart 2.
Chart 2

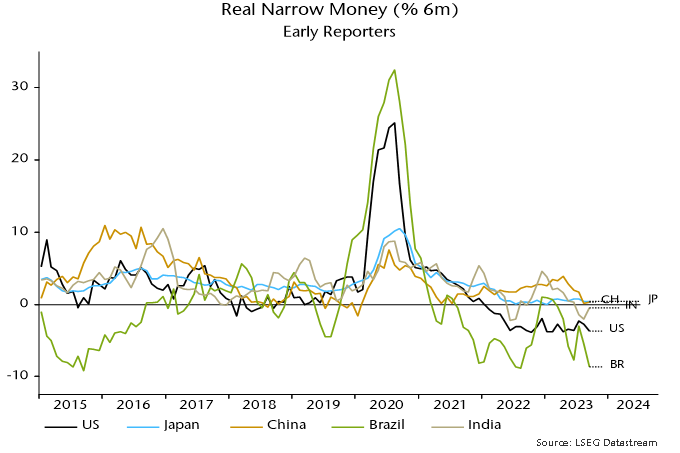
Among countries that have released September data, six-month real narrow money momentum fell in the US and Brazil, was little changed in China / Japan and recovered in India (because inflation reversed lower after a food-driven spike) – chart 3.
Chart 3

Real narrow money momentum is primarily a directional indicator but the current extreme negative reading seems unlikely to be consistent with hopes of a “soft landing”.
One argument for the latter is that a drag on manufacturing trade and activity from a downswing in the stockbuilding cycle is coming to an end, to be followed by a recovery into 2024. A trough by end-2023 has long been the base case here but monetary weakness suggests that the cycle will bump along the bottom rather than enter an upswing.
More precisely, an initial boost from an ending of destocking may fizzle as the usual multiplier effects are offset by slower or falling final demand due to monetary restriction.
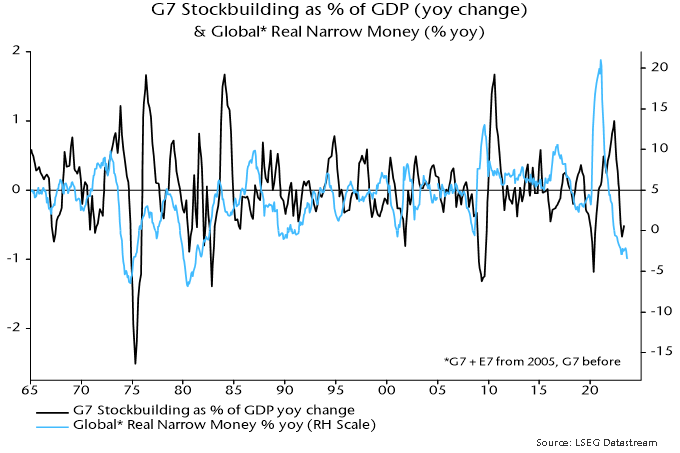
Stockbuilding cycle upswings historically were always preceded by a recovery (of variable magnitude) in global real narrow money momentum – chart 4.
Chart 4

Current conditions are reminiscent of the early 1990s, when real money momentum remained near its low between H2 1989 and H1 1991 and an easing of a stockbuilding drag in 1990 was followed by a relapse into 1991. Monetary weakness, on that occasion, appears to have resulted in an extended cycle, with a final low in Q2 1991 occurring 4 1/2 years after the previous trough in Q4 1986 versus an average cycle length of 3 1/3 years. For comparison, the current cycle started in Q2 2020 so has recently moved beyond the 3 1/3 year average.

Reader Comments (1)
Rates need to come down to boost nominal money growth and geopolitical situations need to end to bring down energy prices and inflation.