UK house prices: still moving sideways
Previous posts argued that UK house prices were supported by the high level and growth of rents and would probably continue to defy bearish predictions. The “best” value- and volume-weighted measures are the LSL Acadametrics and Land Registry indices, because of their larger sample size and inclusion of cash transactions*. These rose by 3.0% and 0.4% in the 12 months to June and May respectively.
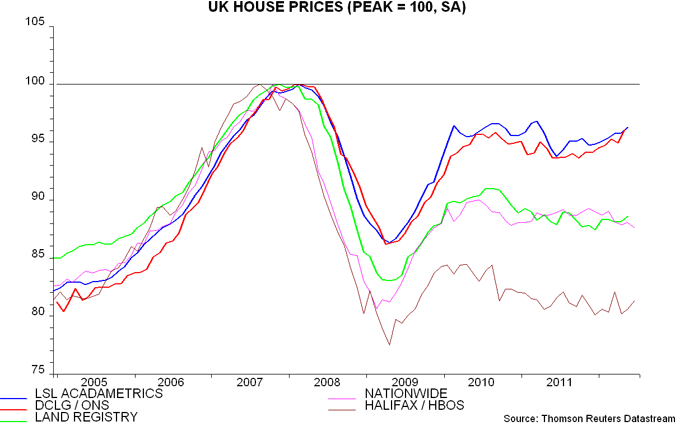
The first chart updates a comparison of five house prices indices, rebased to their respective 2007-08 peaks and seasonally adjusted. The LSL Acadametrics index was only 3.3% below peak in June. Its resilience is confirmed by the Office for National Statistics (previously Department of Communities and Local Government) index, which is also value-weighted and was 3.9% lower in April.
These indices, of course, give greater weight to top-end strength. The volume-weighted Land Registry index, by contrast, was 11.4% below peak in May, though – as noted – has moved sideways over the past year. Its message is confirmed by the Nationwide index, with a shortfall of 12.4% in June, but not the HBOS index, which is down by 18.6%. The HBOS measure has displayed a downward bias relative to the other two volume-weighted indices in recent years, suggesting caution in its use (and explaining its popularity among housing market bears).
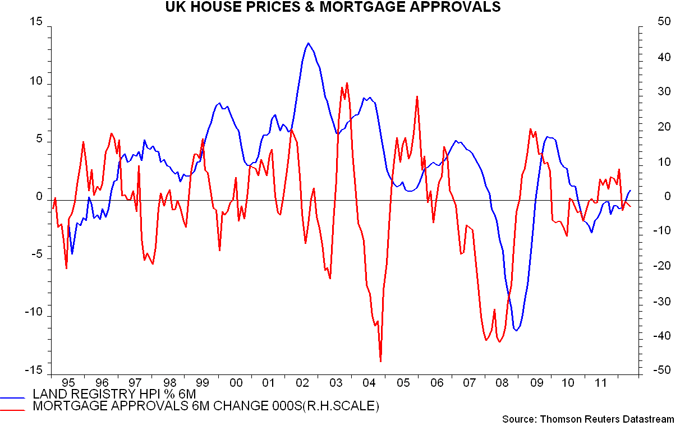
Within a larger picture of stability, house prices may soften modestly during the second half of 2012, based on a recent fall in mortgage approvals – second chart.
*A value-weighted index (i.e. giving greater weight to more expensive houses) should be used if the focus of interest is the aggregate value of the existing housing stock. A volume-weighted measure (i.e. giving equal weight to expensive and inexpensive houses) is appropriate if the focus is the price of a “typical” house.


Reader Comments