
US business money diverging positively from weak Europe
 Simon Ward
 3 Comments
Recent US / European monetary weakness gives a negative signal for economic prospects through mid-2024, at least. US trends, however, are showing signs of improvement in aggregate and in terms of sectoral developments, suggesting smaller downside risk and earlier recovery prospects.
The monthly measure of US broad money tracked here adds commercial bank large time deposits and institutional money funds to the Fed’s M2 aggregate (“M2+”). The former items are important for capturing corporate and institutional money holdings.
The monthly aggregate can be cross-checked against a quarterly M3 measure derived from the Fed’s financial accounts, which additionally includes repurchase agreements. Annual rates of change of the two measures bottomed in March and have recovered to weak positive territory (1.8% for M2+ in October, 1.1% for M3 in September) – see chart 1.
Chart 1
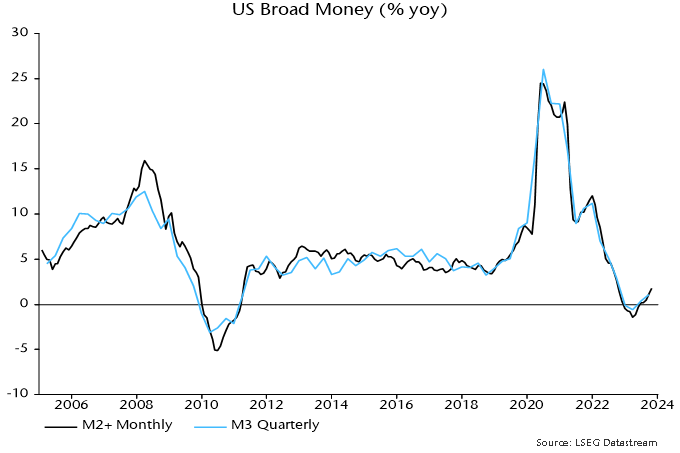
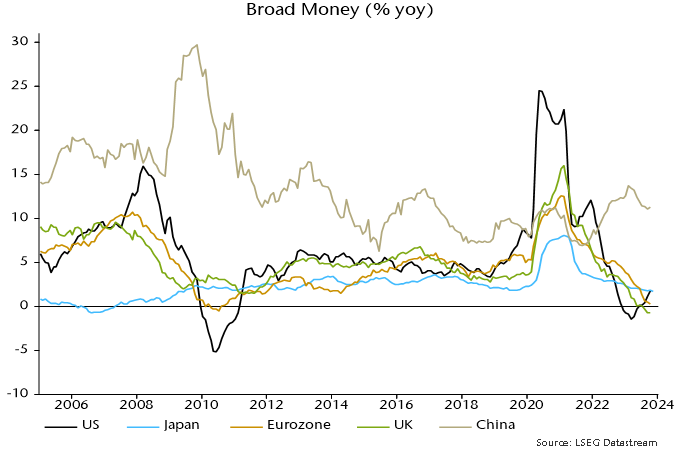
This recovery contrasts with a further decline in annual rates of change of Eurozone and UK broad money, as measured by non-financial M3 and non-financial M4 respectively. The UK series crossed below the US level in July, with the Eurozone following in September – chart 2.
Chart 2
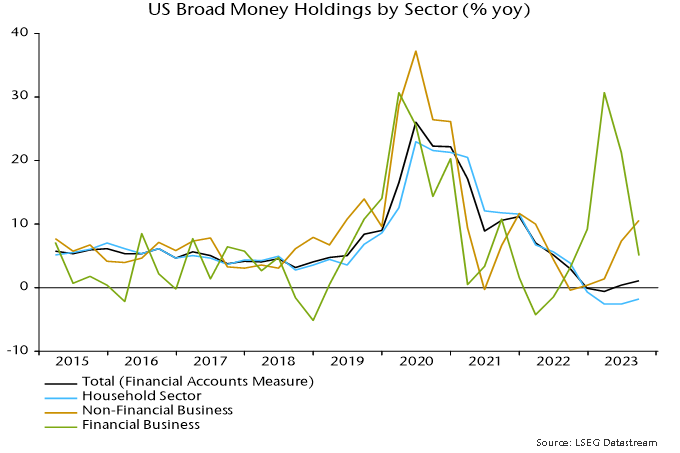
The suggestion that US economic prospects for later in 2024 are less bad than in Europe and improving at the margin is supported by sectoral money developments. Aggregate money is the best guide to economic prospects but changes in business / corporate liquidity usually carry more significance than fluctuations in household money holdings, reflecting their influence on decisions about investment and hiring.
The sectoral M3 breakdown in the Fed’s financial accounts shows that still-weak aggregate broad money growth is explained by a continued fall in the household component, while money holdings of non-financial businesses have bounced back, rising by 10.6% in the year to September – chart 3*.
Chart 3
By contrast, annual rates of change of money holdings of Eurozone / UK non-financial corporations remain negative, with no sign of recovery – chart 4.
Chart 4
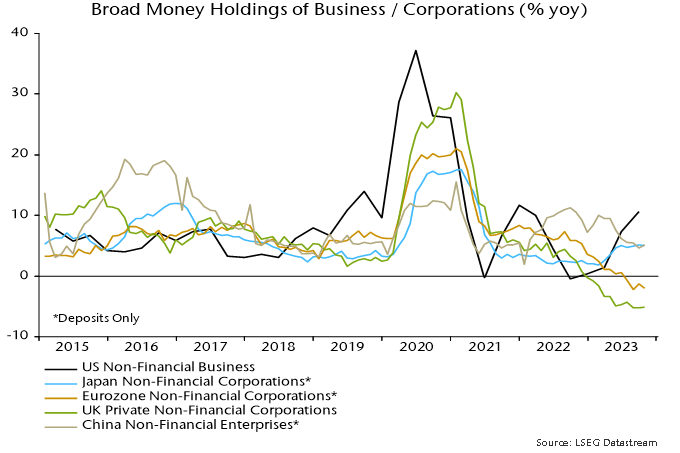
The pick-up in US business money holdings is surprising and may not be sustained but current US / European monetary divergence suggests that US economic outperformance will continue, while a reversal of policy tightening is more urgently required in the Eurozone / UK.
*The pick-up in business money is not fully captured by M2 (because much of the inflow has been into large time deposits and institutional money funds), explaining why M2 is lagging M2+ / M3, falling by 3.3% in the year to October (versus 1.8% growth of M2+).
Questioning US economic "strength"
The 5.2% annualised increase in the headline expenditure-based measure of US GDP in Q3 partly represents payback for earlier weakness. GDP has risen at a modest 1.7% annualised pace since end-2021, well below average expansion of 2.5% in the five years preceding the pandemic (i.e. to end-2019).
The alternative income-based measure of GDP – gross domestic income – paints a much more miserable picture. GDI grew by 1.7% annualised in Q3 alone and by only 0.4% in the seven quarters since end-2021 – see chart 1.
Chart 1
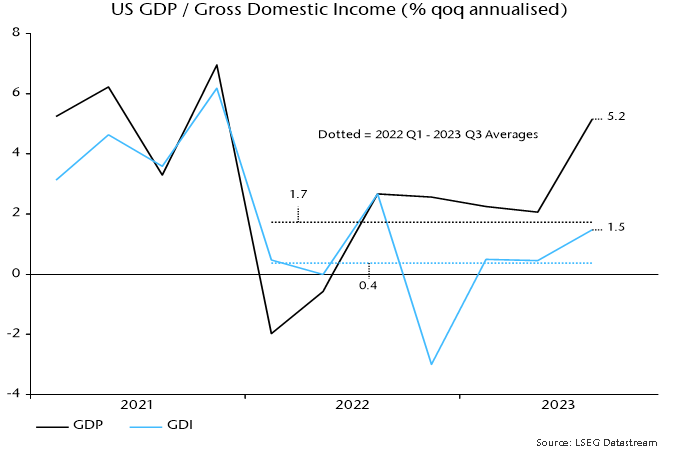
It has been suggested that the GDP / GDI divergence is capturing an increased reliance on borrowing and / or savings depletion to finance spending. This is incorrect: GDP and GDI measure the same concept and the divergence reflects a rising statistical discrepancy, with GDP 2.6% higher than GDI in Q3.
The higher level of GDP does not imply that the GDI measure is less inclusive or accurate. Research by Jeremy Nalewaik, then a Fed economist, found that early GDI estimates were a better gauge of cyclical fluctuations and predicted the direction of future revisions to GDP.
If the national accounts evidence suggests lacklustre performance at best, what explains the consensus perception of US economic “strength”?
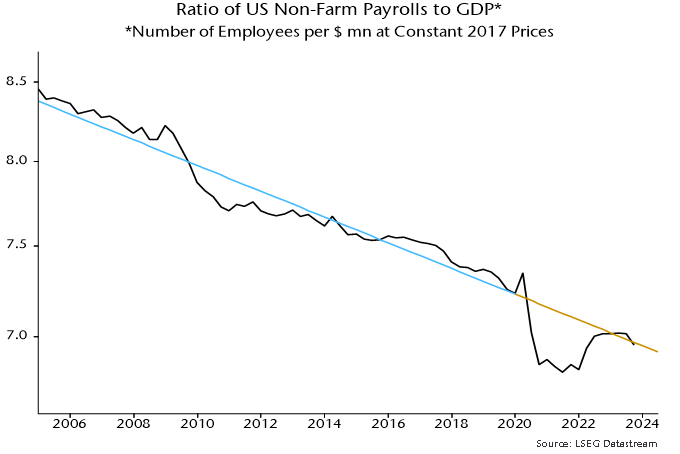
The answer seems to be unusually rapid growth of payroll employment. Payrolls rose at a 2.8% annualised rate between Q4 2021 and Q3, significantly outpacing GDP expansion of 1.7%.
Payrolls strength is judged here to reflect a normalisation of the relationship with the level of GDP, following an undershoot of trend during the pandemic – chart 2. This adjustment appears complete, implying that payrolls will lag GDP going forward (the slope of the trend line implies an annualised growth shortfall of 1.0%).
Chart 2
The GDP / GDI contrast is particularly stark over the latest four quarters, during which GDP grew by 3.0% but GDI contracted by 0.2%.
The table below shows the contributions of GDI components to its change over the past year. With real wage income growing solidly, GDI contraction was attributable to falls in real operating profits of corporations and other private enterprises.

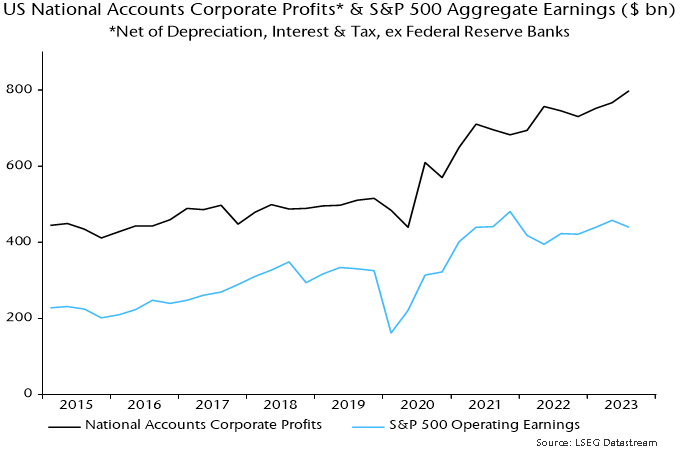
Is national accounts profits weakness consistent with company earnings data? GDI operating profits are gross of depreciation, interest and taxes and exclude foreign earnings, so adjustments are necessary to align with S&P 500 earnings. Chart 3 compares nominal data for S&P 500 aggregate operating earnings and an equivalent national accounts-based measure for corporations excluding the Fed. S&P earnings grew more slowly in the year to Q3, so there is no suggestion of a negative discrepancy in the national accounts numbers.
Chart 3
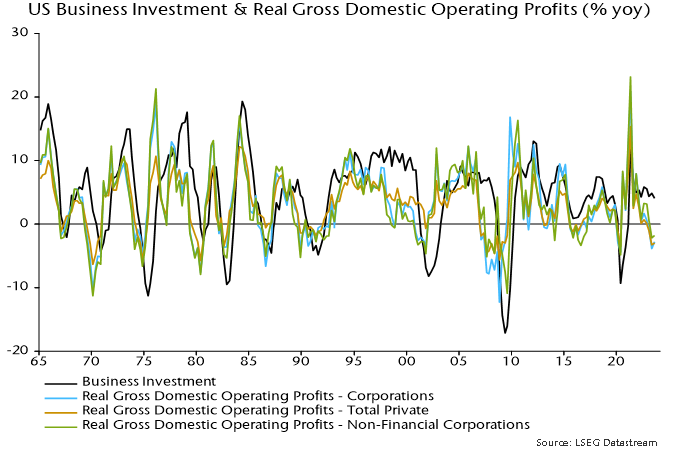
Real operating profits are a leading indicator of business investment so the contraction in recent quarters suggests a capex downturn ahead – chart 4.
Chart 4
Global monetary update: respect the lags
Global six-month real narrow money momentum – a key leading indicator in the forecasting approach employed here – is estimated to have rebounded in October, having reached a new low in September. Allowing for an average 6-7 month lead, this suggests that the global composite PMI new orders index will decline into end-Q1 2024 but may stabilise in Q2 if September is confirmed as a low for real money momentum – see chart 1.
Chart 1
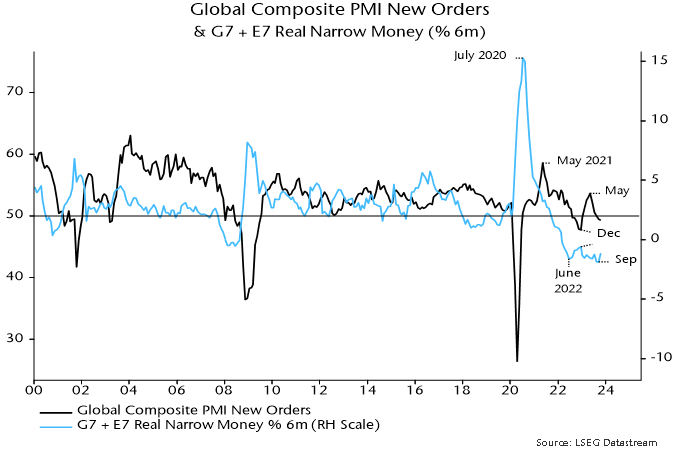
One reason for thinking that September may have marked a low is that six-month consumer price momentum is likely to slow into Q1, based on current commodity prices.
In addition, six-month nominal narrow money momentum in the US, Eurozone and UK, while still very weak, appears to have bottomed, although a significant recovery is unlikely until central banks start easing.
As previously discussed, the main driver of the further fall in global real money momentum into September was a sharp slowdown in China. A hope here that the PBoC would expand liquidity supply to lower elevated money market rates has yet to be realised, suggesting that money trends will remain weak into early 2024. (The PBoC’s Q3 monetary policy report is worrying in this regard, apparently signalling a reduced emphasis on adjusting policy in response to strength or weakness in money and credit.)
Among the major economies, six-month real narrow money momentum has recovered most in the US, although even here remains negative – chart 2.
Chart 2
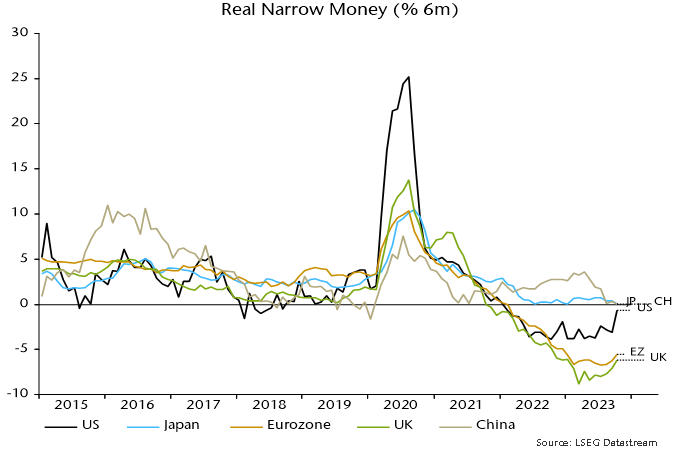
This recovery suggests less bad US economic prospects for later in 2024 but should not be interpreted as implying a reduced probability of a near-term hard landing / recession.
As chart 3 shows, it has been normal historically for six-month real narrow money momentum to start recovering before a recession hits or during its early onset.
Chart 3
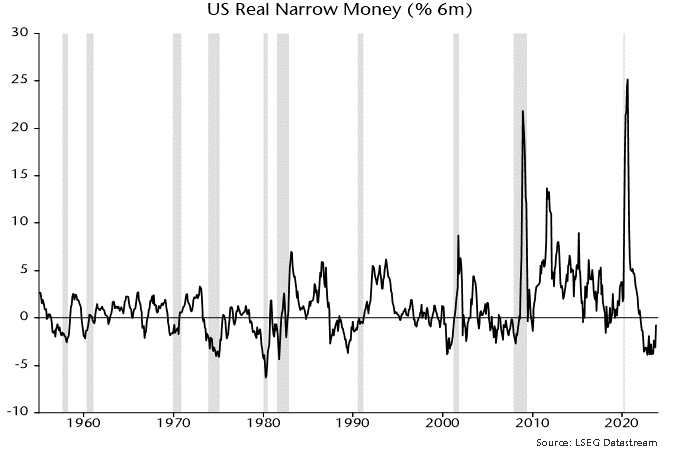
One explanation for this relationship is that recessions are triggered by a sudden switch from spending to saving, with the latter reflected in an accumulation of liquid assets. A reversal of such “hoarding” in response to policy easing is a key driver of an eventual recovery.
So a further US monetary revival could confirm an unfolding hard landing as well as laying the foundation for economic recuperation six to 12 months ahead.
1969-70 replay?
The current constellation of economic cycles resembles the late 1960s, according to the framework employed here. The similarities in terms of US interest rates and labour market trends are striking and suggest major reversals next year.
The longest cycle in the framework is the Kondratyev price / inflation cycle. Kondratyev’s research in the 1920s found evidence of “long waves” lasting about 50 years in global prices and interest rates. Chart 1 shows suggested Kondratyev peaks and troughs in US / UK wholesale price data from the late seventeenth century through WW2.
Chart 1
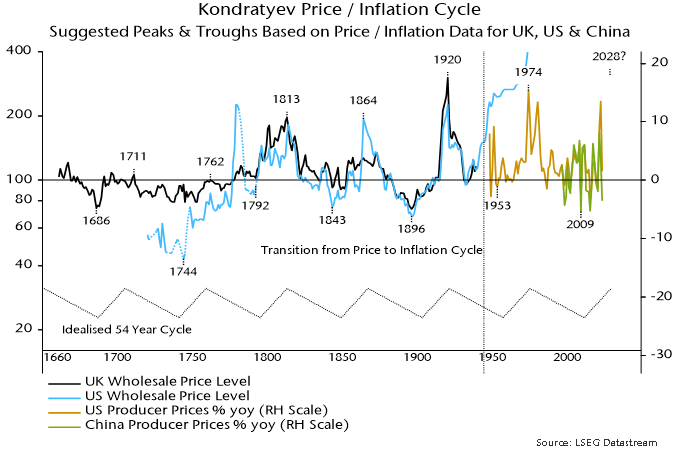
The breakdown of the gold standard in the 1930s untethered monetary expansion, resulting in the price level embarking on a secular rise. The cycle, however, remained visible in rate of change (i.e. inflation) data, with a 1974 peak occurring 54 years after the prior price level peak.
2009 fits the characteristics of a Kondratyev trough and occurred 323 years after the first identified low in 1686. There were five intervening lows, implying an average cycle length (measured from low to low) of 54 years.
Was the 2021-22 inflation spike the culmination of another Kondratyev upswing? A 2022 peak would imply an interval of 48 years from the prior high. The minimum peak-to-peak gap historically was 51 years. The suggestion is that another inflationary upsurge lies ahead, although not until the second half of the decade – current monetary weakness signals a downswing into 2025.
The 54-year periodicity of the Kondratyev cycle harmonises with the average 18-year length of the housing cycle. One Kondratyev cycle, measured from peak to peak, contains three housing cycles, measured from low to low. The first housing cycle of the triad is disinflationary, the second deflationary and the third inflationary.
Chart 2 shows how the housing, business investment and stockbuilding cycles “nest” within the Kondratyev cycle, giving suggested dates for troughs of former three cycles in the previous (1920-74) and current (1974-2028?) Kondratyev cycles.
Chart 2
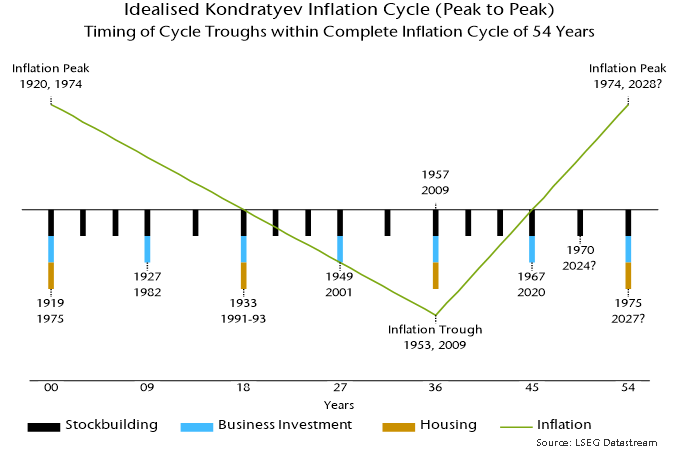
The template implies that cyclical conditions in 2023-24 most closely resemble 1969-70. The stockbuilding cycle was in a downswing within the second half of the final (inflationary) housing cycle since the prior Kondratyev peak.
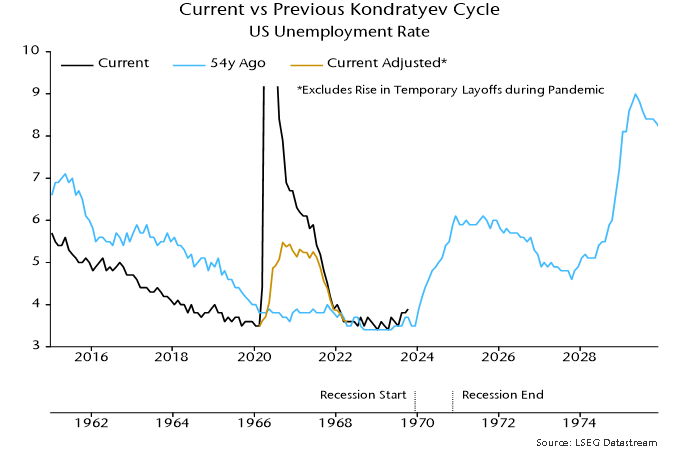
Charts 3 and 4 compare the US Fed funds and unemployment rates with their behaviour 54 years ago. The similarities are striking. The Fed funds rate rose by a cumulative 540 bp over 1967-69, peaking in August. The increase in the current cycle has been 530 bp, with the most recent – final? – hike occurring in July.
Chart 3
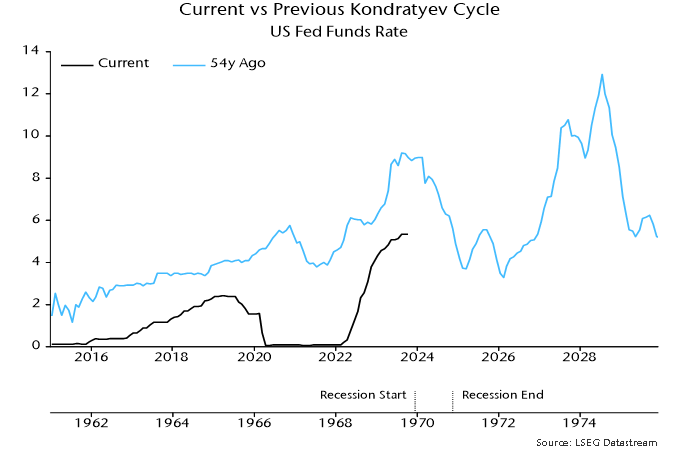
Chart 4
Monetary trends weakened sharply in 1969, causing Milton Friedman to warn of a recession, which started in December. The Fed began cutting rates in March 1970, unwinding the entire 1967-69 rise by February 1971.
The unemployment rate bottomed in the late 1960s at the same level as recently – 3.4% – and had edged up to 3.7% by October 1969 compared with 3.9% this October. It surged after the economy entered recession, peaking at 6.1% in December 1970.
The suggested takeaway is that cycle considerations support the current message from monetary trends – that recession risk remains high and a major Fed policy reversal is likely in 2024.
Chinese money trends reflecting PBoC caution
Chinese six-month money growth rates were little changed in September / October following a sharp slowdown over the summer, suggesting weak economic prospects through end-Q1 2024. A small consolation is that recent monetary softness is partly explained by a rise in government deposits at the PBoC, representing yet-to-be-deployed fiscal firepower.
Narrow money trends are most concerning. Six-month growth of true M1 in October was the weakest since late 2014, ahead of the 2015-16 hard landing scare – see chart 1. Sectoral figures show a contraction of demand deposits of non-financial enterprises partly offset by weak but rising household deposit growth. This divergence was echoed in October activity data, with retail sales modestly better but private fixed asset investment continuing to flatline.
Chart 1
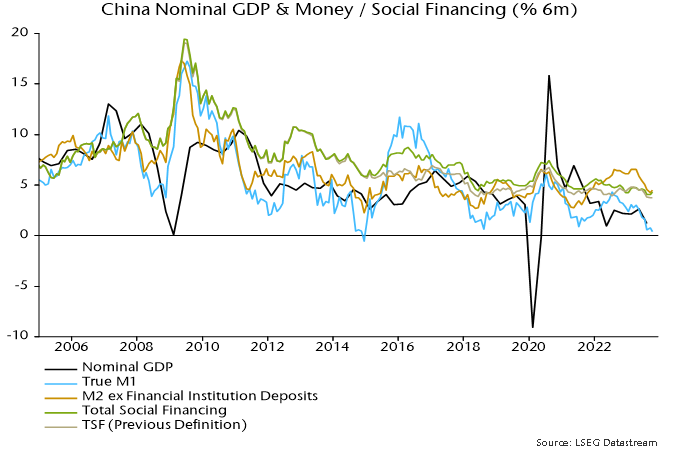
Credit growth has held up better than monetary expansion but total social financing has been supported by record issuance of local government special bonds. These were excluded from the previous TSF definition, which is a better guide to non-government credit trends and has fallen further – chart 1.
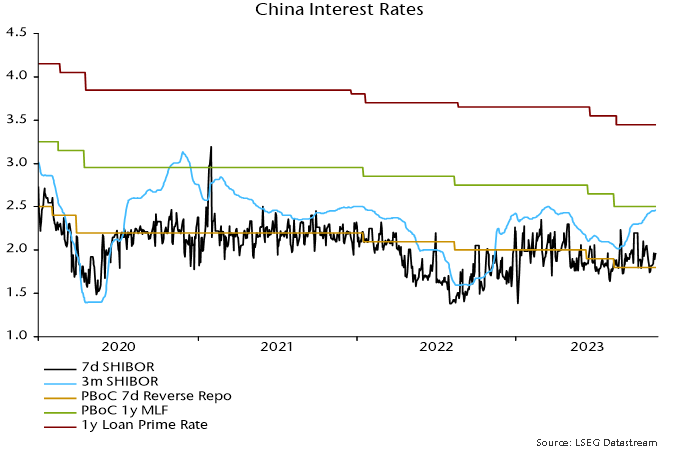
The spring / summer slowdown in money / credit reflects PBoC tightening around end-2022 and an associated sharp rise in money market rates. A reversal of this increase into August warranted a hope that money growth would recover in late 2023 but term rates have since returned to their high, though may be peaking – chart 2.
Chart 2
A previous post based on data through September argued that money market tightness had been partly caused by “overfunding” of the budget deficit, i.e. bond issuance to finance future spending. Excess borrowing accelerated in October, with fiscal deposits at the PBoC rising by a whopping RMB 1.7 trillion on the month – chart 3. This explains why large-scale PBoC injections have yet to bring down market rates.
Chart 3
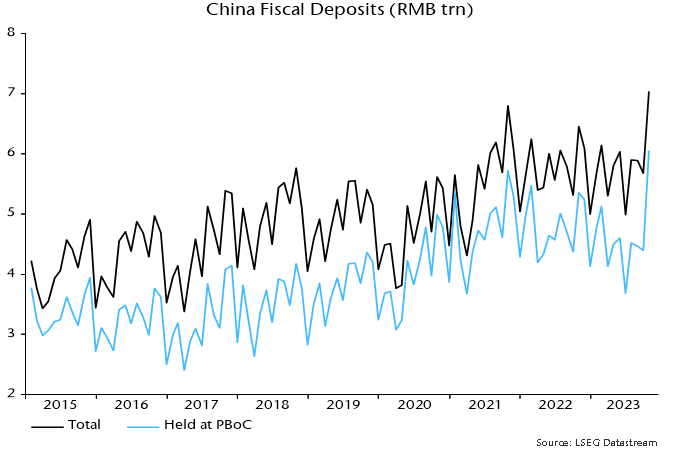
The silver lining is that bank reserves and money growth will benefit as this fiscal firepower is deployed.
The potential boost to narrow money is modest – a fall in fiscal deposits from the current RMB 7.0 trillion to their 2022 average of RMB 5.8 trillion would, if fully reflected, add 1.2% to true M1. Additional PBoC easing measures are needed for a material improvement in monetary and economic prospects.