
Why have real yields risen?
 Simon Ward
 Post a Comment
Why have global government bond yields picked up over the summer despite weakening PMIs and neutral / favourable inflation news?
The rise is attributed here to a further deterioration in the global “excess” money backdrop driven partly by unexpected output strength as an easing of supply constraints has allowed firms to work off order backlogs. Output is expected to realign with weak / falling incoming demand during H2, suggesting a reversal of liquidity tightening.
The rise in nominal yields has been driven by the real component with inflation expectations little changed.
Changes in real yields have been inversely correlated historically with changes in global “excess” money momentum, as measured by the differential between six-month rates of change of real narrow money and industrial output – see chart 1.
Chart 1
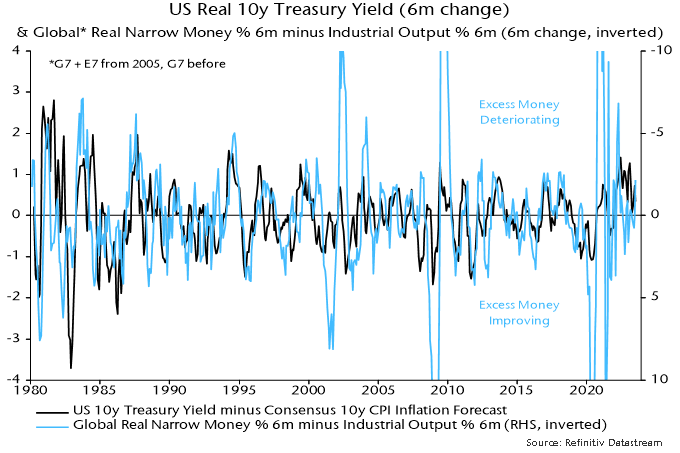
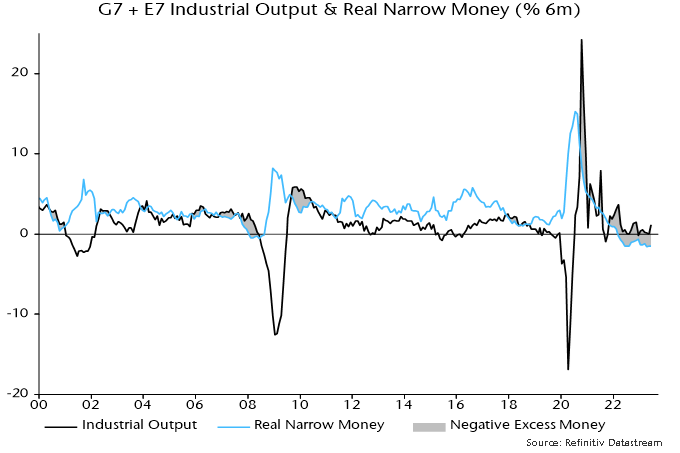
This differential has been negative since early 2022 but was expected to narrow as monetary tightening fed through to weaker economic activity and slowing inflation lifted real money momentum. Instead, industrial output growth rose to a seven-month high in June while nominal money weakness has offset a disinflation boost to real momentum – see chart 2.
Chart 2
Production resilience was signalled by a recovery in the global manufacturing PMI output index, which crossed 50 in February on the way to a May high. It moved back below breakeven in June / July, however, with August flash results suggesting a return to the December 2022 level or lower – see chart 3.
Chart 3
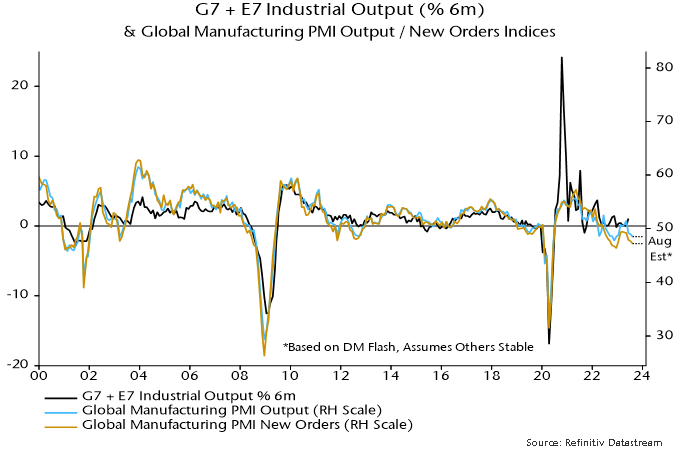
Covid-related supply disruption resulted in the PMI output index lagging the new orders index in 2021 / H1 2022, but the position has reversed over the past year as production bottlenecks have eased, allowing firms to fulfil outstanding orders.
With the PMI delivery speed index – an inverse indicator of bottlenecks – hitting a 14-year high in May, the supply catch-up is probably ending, suggesting that the PMI output index – and hard production data – will converge with weaker new orders. At the current level of the latter index, this would imply output contraction.
The real narrow money / industrial output momentum differential, therefore, is likely to narrow unless nominal money data weaken further and / or consumer price inflation rebounds (unlikely). While G7 tightening is still feeding through, stable / easier monetary policies are expected to promote money growth recoveries in EM.
Commentaries here have suggested that the monetary / economic backdrop would favour quality stocks in 2023. The MSCI World quality index is 7.1% ahead of MSCI World in price terms year-to-date (as of yesterday’s close). This mainly reflects a high weighting in tech, but the sector-neutral quality index (which imposes MSCI World sector weights) is also now outperforming the main index and has reversed its relative weakness in 2022 – see chart 4.
Chart 4
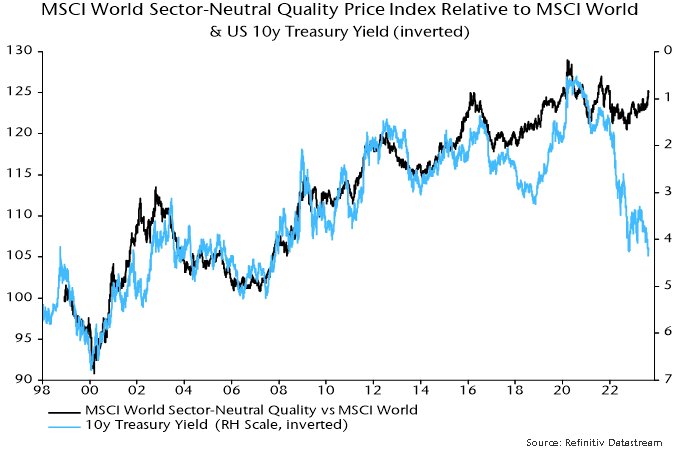
The recent relative gain is striking against the backdrop of rising Treasury yields, with which the style has been inversely correlated historically, as the chart shows. The divergence is reminiscent of 2018, when the quality relative embarked on a sustained rise in February but a fall in Treasury yields was delayed until November. This year’s quality rally also started in February, suggesting a resolution of the current disconnect with yields by year-end.
 View Printer Friendly Version
 Email Article to Friend
Reader Comments