UK money trends still solid
UK money / inflation trends suggest that economic growth will firm during the second half of 2015 before moderating again in early 2016.
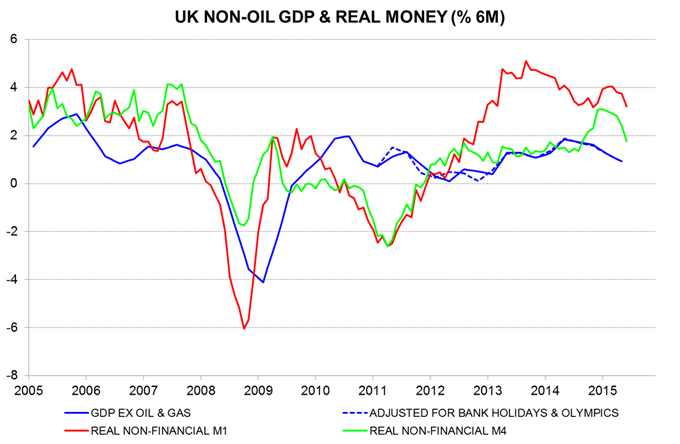
The best monetary leading indicator of the economy is “real non-financial M1”, defined as the stock of notes / coin and sight deposits held by households and private non-financial corporations deflated by consumer prices. This measure gave advance warning of the 2008-09 recession, the 2011-12 “double dip” scare and the 2013 growth surge – see first chart.
It also correctly signalled the recent modest economic slowdown. Six-month growth of real non-financial M1 peaked in September 2013, while the two-quarter increase in non-oil GDP topped out in the second quarter of 2014 – the difference of about eight months is in line with the Friedman / Schwarz finding of a typical lead time from money to output of between six and nine months*.
The two-quarter non-oil GDP change continued to moderate in the second quarter but is probably bottoming. Six-month real non-financial M1 growth stabilised between August and December 2014 before strengthening in early 2015, peaking in March. This suggests that two-quarter GDP expansion will rise to another top in either the fourth quarter of 2015 or the first quarter of 2016.
Quarterly GDP rises in the third and fourth quarters may exceed 0.6%, satisfying one of Bank of England Governor Mark Carney’s latest three conditions for policy tightening (the others being a pick-up in unit labour cost growth and a recovery in “core” inflation).
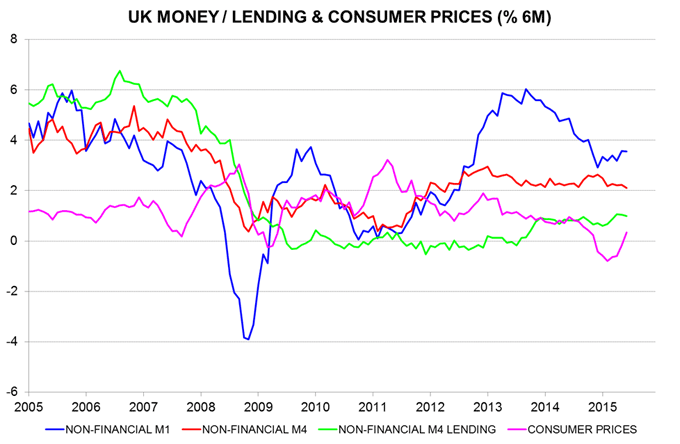
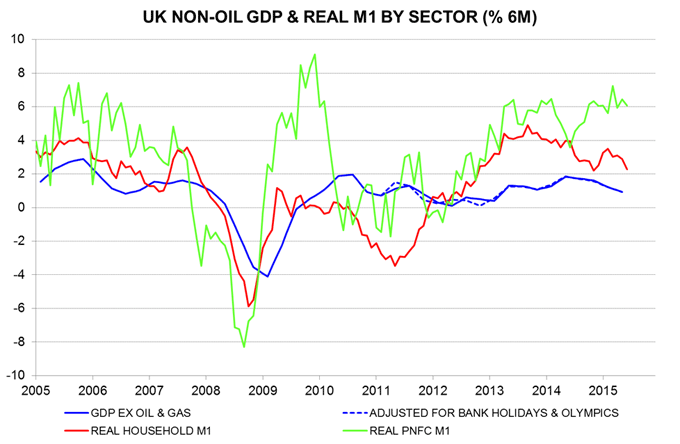
The fall in real non-financial M1 growth since March may not signal a significant economic slowdown from early 2016, for two reasons. First, the decline reflects a recovery in six-month consumer price inflation rather than lower nominal money expansion – second chart. Secondly, real corporate M1 continues rise fast and is better correlated with future economic performance than household M1 – third chart.
*A study here of G7 data since the 1960s found an average lead time between real narrow money and industrial output of nine months (further details on request).


Reader Comments