Dow six-bear comparison: further update
A prior post presented a comparison of the rebound in the Dow Industrials index from its trough in March 2009 with recoveries after the six largest twentieth-century bear markets, excluding the devastating 1929-32 decline. These bears involved index falls of 45-52%, similar to the 54% drop over October 2007-March 2009. (Prices slumped by 89% over September 1929-July 1932.)
At the time of the earlier post, the Dow had moved down to converge with the "six-bear average" of these earlier recoveries. With liquidity conditions for markets having deteriorated, a fall into the lower half of the historical range seemed likely in the short term, although a significant undershoot of the average might present a buying opportunity.
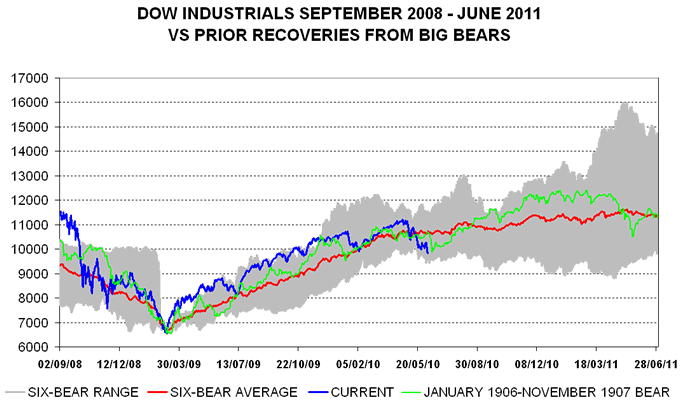
Updating the analysis, yesterday's Dow close was 8% below the six-bear mean and 1% above the bottom of the historical range – see chart.
Examining the six components, the recovery since March 2009 bears the strongest resemblance to the rebound after the January 1906-November 1907 decline. The Dow was mostly above the six-bear average during the early stages of this revival but a significant correction set in after about a year, echoing recent market weakness.
Like the recent bear, the January 1906-November 1907 decline was associated with a credit bust and financial panic that drained liquidity from markets. Both crises climaxed with the failure of a major bank – the Knickerbocker Trust Company in October 1907, Lehman Brothers in September 2008 – and a subsequent decisive "official" rescue effort (co-ordinated by J P Morgan in 1907, before the institution of the Federal Reserve). The economic consequences were similar, with a severe one-year recession in industrial output followed by a strong rebound.
Relative to the bear-market trough, the Dow is currently very close to its level at the same stage of the post-November-1907 recovery – see chart. On that occasion, prices were reaching a low and rallied by more than 20% over the following six months.
The "six-bear" evidence, therefore, suggests that market weakness will abate. Resumption of an uptrend, however, requires an improvement in liquidity indicators.

Reader Comments