US margin excess confined to financials
Some commentators argue that US stocks are more expensive than suggested by market price/earnings (P/E) measures because corporate margins are unusually high and should revert to average over coming years, depressing earnings.
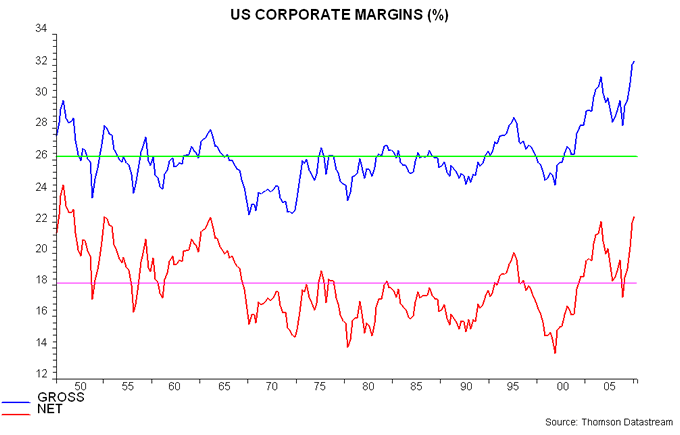
The first chart shows gross and net corporate margins, calculated from national accounts data. The gross measure expresses the sum of profits, interest and depreciation as a percentage of corporate gross domestic product. Gross margins are at a record high and would have to fall by 19% to return to the historical average.
The current overshoot, however, is exaggerated by a long-run upward trend in depreciation, reflecting a combination of a rising capital/output ratio and a declining average life of capital goods. Margin sustainability is better judged using a net measure, excluding depreciation from both the numerator and denominator of the ratio (i.e. profits plus interest as a percentage of net product). Net margins, while high, are within the historical range and less stretched relative to the average.
The aggregate figures, moreover, obscure a bigger story: the divergence between the financial and non-financial sectors – second chart. Financial net margins are at a record high and would need to fall by 41% to restore the historical average. Non-financial margins, by contrast, are at a normal historical level, having moved temporarily below the average during the recession.
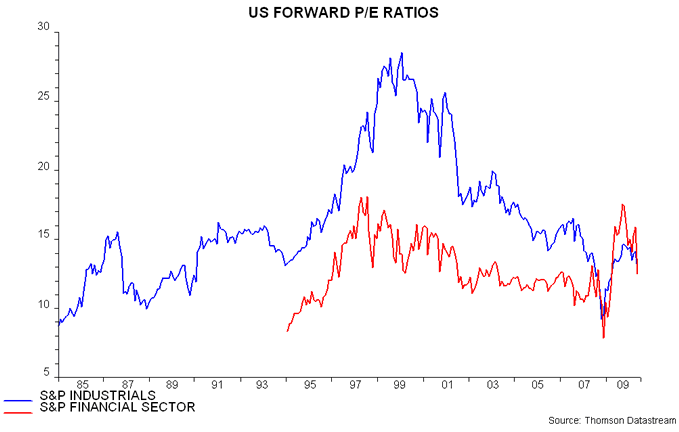
This suggests that non-financial P/E measures should not be significantly distorted by unusually-high margins currently but financial P/Es may be misleadingly low, in turn depressing market-wide valuations. The third chart shows forward P/E ratios, based on 12-month-ahead earnings estimates, for the S&P Industrials and Financial Sector indices.
The Industrials P/E is roughly in the middle of the historical range excluding the late 1990s bubble period. The Financials P/E is lower but the discount is smaller than usual. If earnings were recalculated based on average margins, moreover, the Financials P/E would be far above that of the Industrials and at the top of the historical range.
Possible margin compression, therefore, is a reason for caution on financial stocks but much less so for the rest of the market.


Reader Comments (3)
A breath of fresh air again, Simon - thank you.
On your US forward PE ratios chart, all the historical data must be 'actual', whereas only the most recent data point is 'forward' - is that correct?
Thanks
APB
No, all the data points are based on forward earnings estimates.
Ok - which makes late-08 a standout buy!
Thanks Simon
APB