Chinese weakness due to policy misstep
Pessimistic commentators argue that the Chinese economy has entered a “liquidity trap” and faces Japan-style deflation. This assessment is not shared here: a recent monetary slowdown can be explained by misguided policy tightening around end-2022, which is now being reversed, while broad money growth would need to fall much further to suggest a sustained decline in prices.
A review of monetary policy in recent years is helpful in understanding current conditions. An important consideration is that – like the Fed decades ago – the PBoC does not announce changes in its policy stance, which often become apparent only after the event in movements in money market rates and credit / monetary trends.
The PBoC eased policy between late 2020 and summer 2022 to cushion covid-related economic weakness. Three-month SHIBOR fell from over 3% to 1.5%, while six-month growth rates of money and credit began to pick up from mid-2021 – see charts 1 and 2.
Chart 1
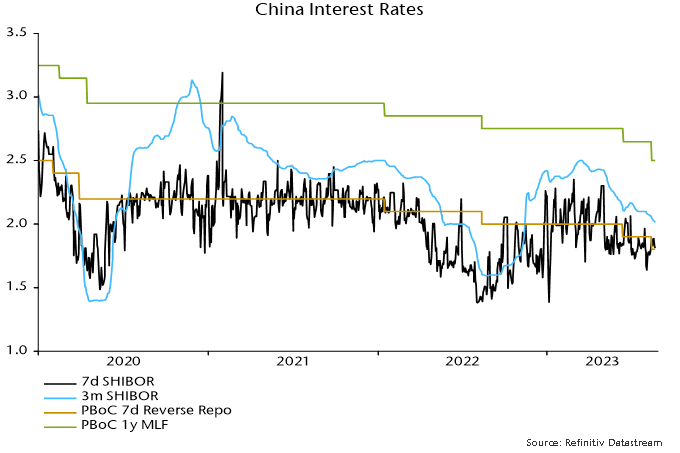
Chart 2
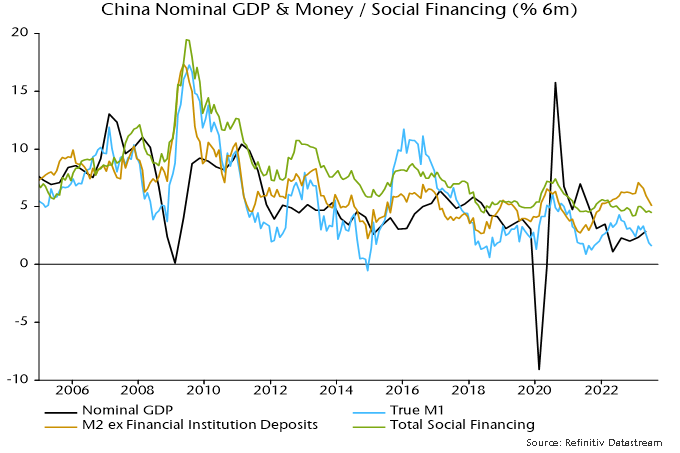
Narrow and broad money measures continued to accelerate in H1 2022, laying the foundations for a solid post-reopening economic recovery in H1 2023 – real GDP grew by 6.1% annualised between Q4 2022 and Q2 2023.
The PBoC, however, blotted its copy book in late 2022, tightening policy on misplaced concern about a reopening-driven inflation pick-up, although narrow money and credit growth were by then cooling and the ratio of broad money to nominal GDP was close to trend (in contrast to the US / Europe, where a large monetary overhang fuelled strong price pressures).
Three-month SHIBOR rebounded from 1.7% in September to 2.4% by year-end, rising further to 2.5% in March. The consensus view at the time – not shared here – was that the rise in money rates reflected stronger money demand due to reopening, i.e. the increase was “endogenous” rather than policy-driven and would not threaten economic prospects.
Policy tightening has resulted in six-month narrow and broad money growth falling to late 2021 levels, although credit expansion has declined by less (despite a very weak July flow number) – chart 2. The monetary slowdown suggests a loss of economic momentum through late 2023.
The PBoC has, at least, been swift to recognise its error, resuming easing in early Q2. Three-month SHIBOR has retraced half of its August-March rise but may need to return to the low to offset recent monetary damage.
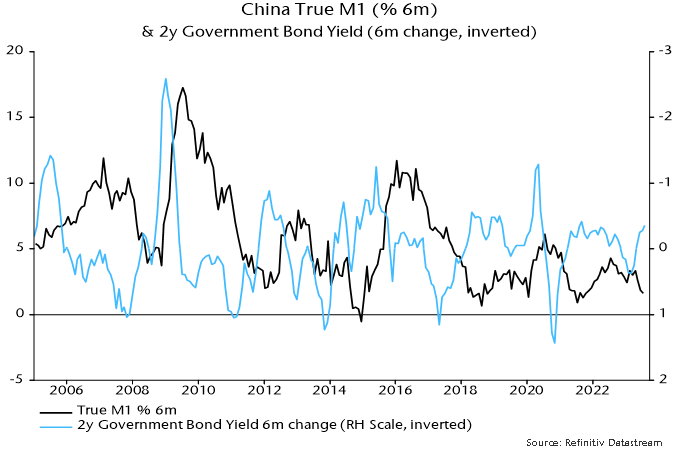
Chart 3 illustrates the inverse leading relationship between changes in interest rates (in this case the two-year government yield) and narrow money momentum. The reversal in rates suggests a bottoming out and revival in money momentum, although timing is uncertain.
Chart 3
Why did Japan enter a sustained deflation in the early 1990 and are there parallels with current Chinese conditions?
From a monetary perspective, a deflationary environment requires (broad) money growth to fall below the sum of trend real GDP growth and the trend rise in the money / nominal GDP ratio.
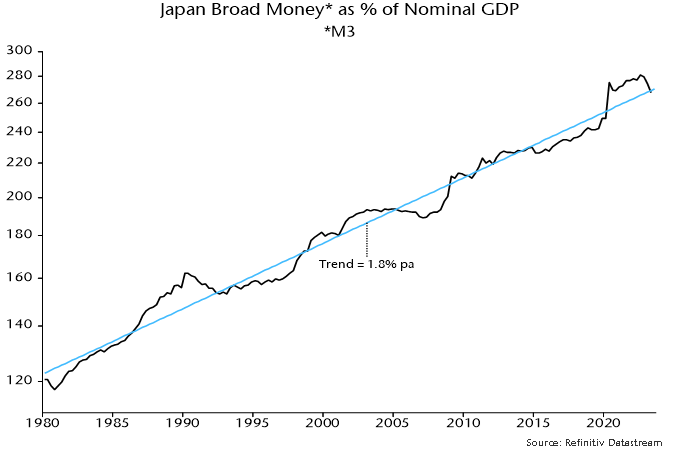
The ratio of Japanese broad money M3 to nominal GDP has risen by 1.8% pa on average over the long run – chart 4. Trend real GDP growth was running at about 2% in the early 1990s, so broad money needed to expand by about 4% pa to maintain stable prices. Annual growth fell below this level in 1991 on the way to zero in 1992, averaging 2.7% over 1991-2000.
Chart 4
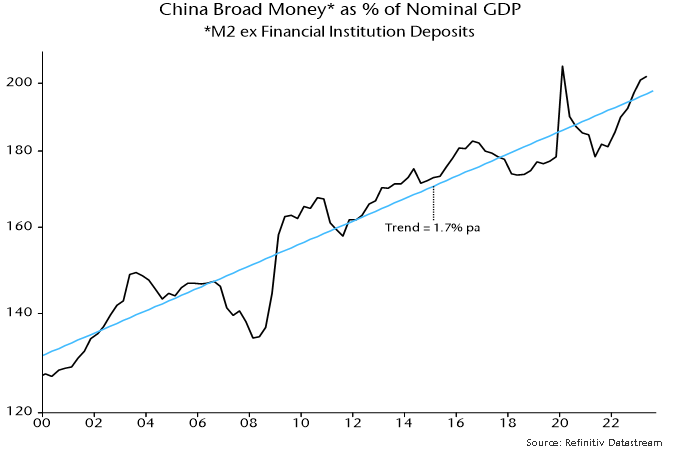
China’s broad money to nominal GDP ratio has risen at a similar trend rate of 1.7% pa – chart 5. If trend real GDP growth is assumed to be about 5%, broad money expansion needs to stay above about 7% to avoid a deflationary scenario. Annual growth is currently 11.6%, with the six-month rate of increase at 10.4% pa.
Chart 5

Reader Comments (1)
When will we see easing from other central banks I wonder?
Rather concerningly the street view seems to be that ECB et al will merely skip a hike in September but still go ahead in October!
To me this seems improbable, though that has also been true for much of the hiking cycle.