
A "monetarist" perspective on current equity markets
 Simon Ward
 1 Comment
Monetary and cycle aspects of the forecasting approach used here are currently in tension. Global real narrow money trends suggest a renewed weakening of economic momentum into late 2023. Cyclical forces, however, are scheduled to become more supportive from early 2024 as the stockbuilding cycle bottoms out and moves into a recovery phase.
The two messages can be reconciled if real money momentum recovers over the remainder of 2023, confirming an improving outlook for 2024. Momentum is expected to be lifted by a further slowdown in inflation but a sufficient recovery is unlikely without a policy reversal by major central banks. Current signals are that such a reversal will require a dramatic deterioration in economic data and / or major market weakness.
Economic news has been confusing, allowing optimists and pessimists to claim support for their assessments. Weakness appears the correct interpretation based on national accounts data. An average of the expenditure and income measures of US GDP rose at an annualised rate of only 0.3% in the five quarters to Q1 2023. The monthly measure of UK gross value added has flatlined since last summer while Eurozone GDP slipped into contraction in Q4 / Q1.
Claims of economic resilience or even strength focus on solid employment growth and tight labour markets. Weak GDP expansion has been unusually jobs-rich because of a rebound in the share of lower-productivity services activities. With the goods / services split normalising, this composition boost is probably ending.
GDP / employment divergence has been echoed in PMIs, with manufacturing weakness balanced by services strength. Again, the assumption here is that services exceptionalism is temporary, reflecting a later release of pent-up demand, suggesting focusing on manufacturing as a better guide to trend.
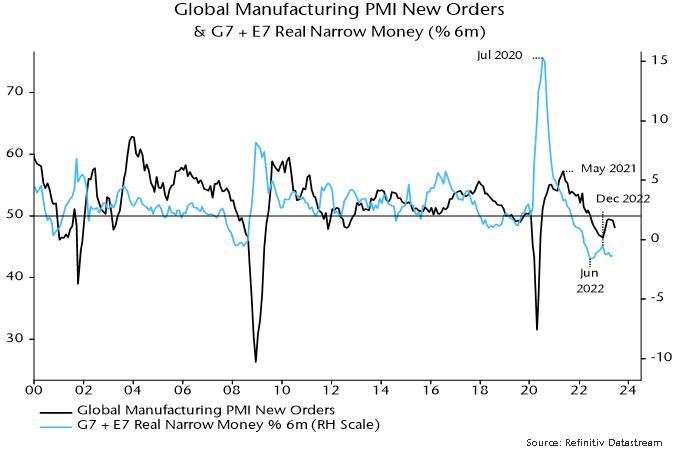
The global manufacturing PMI new orders index reached a 31-month low in December 2022, recovering modestly into the spring before falling back sharply in June. A revival and relapse had been signalled by six-month real narrow money momentum, which recovered during H2 2022 but eased again in early 2023. The recent slide extended into May, suggesting further PMI weakness into late 2023 – see chart 1.
Chart 1
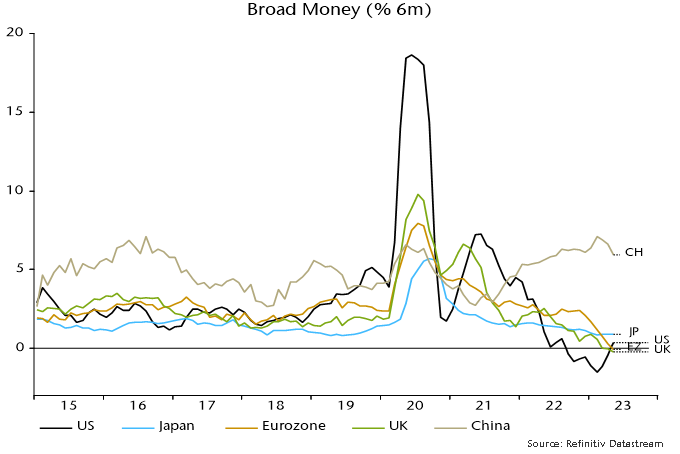
Monetary alarm bells are ringing loudest in Europe. Six-month rates of contraction of Eurozone and UK nominal narrow money quickened further in May, contrasting with less negative and stabilising US momentum – chart 2. Six-month changes in broad money have also now crossed below zero and the corresponding US change – chart 3. Trends in Sweden and Switzerland are even weaker.
Chart 2
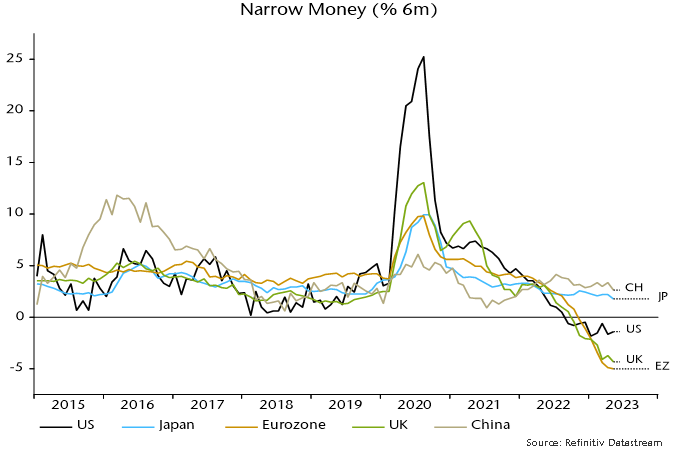
Chart 3
China and India remain positive monetary outliers but narrow money momentum is modest by historical standards and has subsided recently. Relative to monetary trends, the consensus view on China looked overoptimistic at the start of 2023 and appears excessively gloomy now, although further policy easing is warranted to cushion the economy against likely export weakness despite a super-competitive exchange rate.
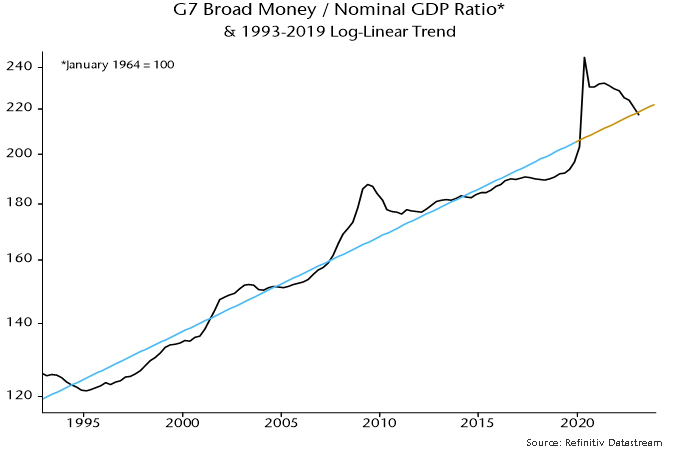
To the extent that the global economy has proved more resilient than expected, one explanation is that the impact of monetary weakness has been delayed by an overhang of “excess” money balances / savings resulting from 2020-21 stimulus. The ratio of G7 broad money to nominal GDP crossed back below its pre-pandemic trend in Q1 2023, suggesting that stock and flow arguments for pessimism are becoming aligned – chart 4.
Chart 4
Cycle analysis is used here to provide longer-term context and a cross-check of monetary signals. Economic fluctuations reflect the interaction of three investment cycles: a shorter stockbuilding cycle typically of about 3 1/3 years in duration; an intermediate business investment cycle of 7-11 years; and a longer housing cycle averaging about 18 years.
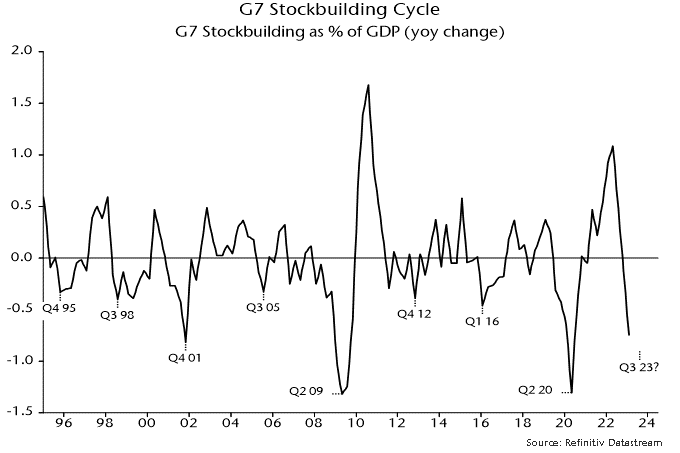
The business investment and housing cycles last reached lows in 2020 and 2009 respectively. If current cycles are of normal length, the next lows could occur in the late 2020s. Downswings into lows typically play out over 1-3 years so are unlikely to begin before 2025. This suggests that recent softness in housing and business investment represents a temporary correction within ongoing upswings. Current cyclical weakness, on this interpretation, reflects a downswing in the shorter-term stockbuilding cycle, which last bottomed in Q2 2020 and recently entered the time band for another low.
Stockbuilding cycle downswings in isolation are usually associated with global economic slowdowns or at worst recessions that are modest and / or geographically contained. Examples of the latter include the 1970 US recession and the 2011-12 Eurozone downturn. Against a backdrop of monetary weakness and unusually rapid policy tightening, the expectation here has been the current downswing would be more severe and global than the norm.
The cycle analysis suggests, however, that the window for severe economic weakness will begin to close from late 2023. Recent stockbuilding data indicate that the cycle downswing is already well-advanced, consistent with a low being reached before year-end – chart 5. A stockbuilding recovery could combine with continuing upswings in business and housing investment to drive global economic reacceleration in 2024-25. As noted, however, such a scenario requires confirmation from an early recovery in real money momentum, in turn probably dependent on H2 policy reversals.
Chart 5
The “monetarist” forecast was that G7 headline CPI inflation would fall rapidly from early 2023, mirroring a large and sustained decline in annual broad money growth from a February 2021 peak. This scenario is playing out: a GDP-weighted average of G7 national headline rates dropped from 6.8% in January to 4.8% in May, with a further decline to 4.2% projected for June – chart 6.
Chart 6
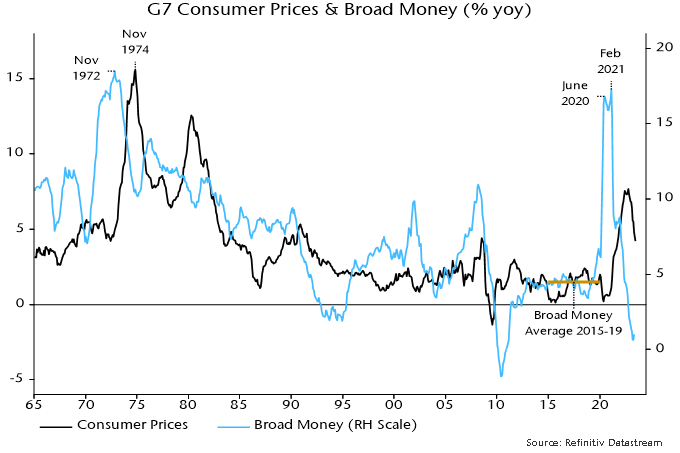
Broad money growth returned to its pre-pandemic average in mid-2022 so – allowing for a standard two-year lead – inflation rates may be back at pre-pandemic (i.e. target-consistent) levels in mid-2024. Recent further monetary deceleration suggests significant risk of an undershoot in late 2024 / 25. The cyclical counterargument is that stockbuilding cycle upswings are usually associated with rising commodity prices, which may support headline rates moving through 2024.
A tendency of policy-makers and commentators to downplay headline progress and focus on stickier core readings is the mirror-image of 2021 claims that a headline surge was “transitory”. Disinflation is following the usual sequence from commodities to goods to lagging services / wages. Recent US / Eurozone data confirm a downshift in short-term core momentum, e.g. US “super-core” consumption prices – ex. food, energy, housing and used cars – rose by an annualised 3.1% between February and May, the smallest three-month gain since December 2020.
The two global “excess” money indicators calculated here – the gap between six-month real narrow money and industrial output momentum, and the deviation of 12-month real narrow money momentum from a slow moving average – have been negative in most months since the start of 2022, suggesting an unfavourable backdrop for equity markets. Despite a strong H1 rally, the MSCI World index was 8.2% below its closing 2021 level at end-June. Cyclical sectors (including tech) lagged defensive sectors (including energy) over this period.
An earlier hope that the first measure – the real money / output momentum gap – would turn positive during H1 was dashed by a combination of renewed monetary weakness and a production boost from an easing of supply constraints. With June global manufacturing PMI results signalling output contraction, a cross-over remains possible soon. The second measure – the deviation of real money momentum from a moving average – is further from a switch.
Historically, equity markets outperformed cash on average only when both measures were positive – still a distant prospect. Both the current negative / negative and possible positive / negative configurations were associated with non-energy defensive sectors outperforming non-tech cyclical sectors.
 View Printer Friendly Version
 Email Article to Friend
Reader Comments (1)
I wonder if nominal narrow money trends may be more indicative of economic prospects in the current cycle. Given inflation volatility from the prior stimulus.
We should also consider if excessively tight monetary policy won't bring forward the bottom in the housing cycle.
Possibly meaning we'll see a two stage recession with housing and employment weakness driving a further downturn from H2 2024.
It seems unlikely we'll see significant rate cuts before employment significantly deteriorates in this cycle.