
A "monetarist" perspective on current equity markets
 Simon Ward
 4 Comments
High inflation resulted in poor equity market performance in 2022 despite economic / earnings growth. Inflation relief in 2023 may limit further market weakness despite a global recession.
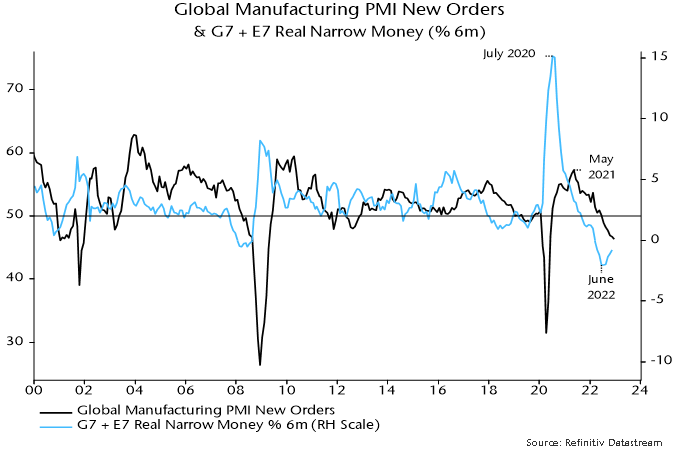
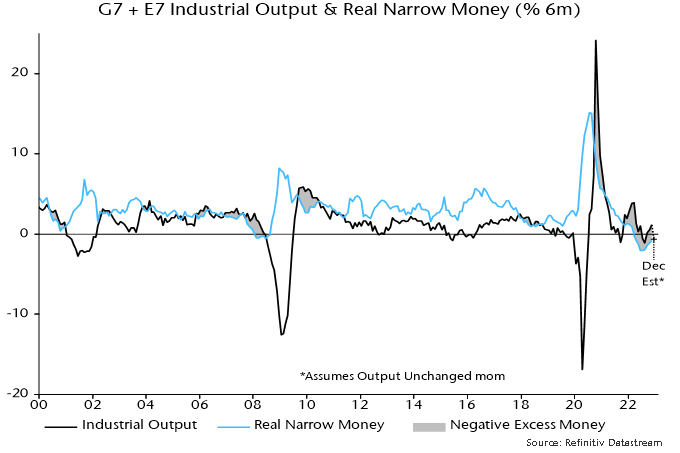
Absent shocks, economic momentum usually reflects real money trends six to 12 months earlier. Global six-month real narrow money momentum turned negative in March 2022, reaching a low in June before recovering slightly into November – see chart 1. This suggests that economic weakness will intensify in early 2023, with no monetary signal yet of a subsequent meaningful rebound.
Chart 1
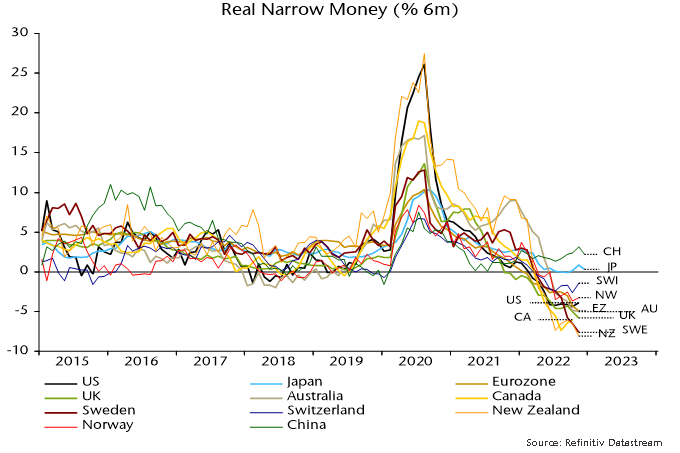
Real money contraction is fastest in the housing bubble / bust economies of New Zealand, Sweden and Canada, although the UK, Eurozone and US are only slightly behind – chart 2. China and Japan are positive outliers, suggesting less unfavourable prospects.
Chart 2
Hopes are high that China’s covid policy U-turn will lead to a V-shaped economic recovery, as occurred in G7 economies post reopenings. Strong G7 rebounds, however, followed a surge in money growth. Chinese real narrow money expansion is still modest by historical standards and a rise in money rates in late 2002 may indicate less expansionary PBoC policy, possibly reflecting concern about inflationary effects of rapid reopening.
Still-negative global real narrow money momentum indicates that a Chinese economic pick-up won’t offset recessions elsewhere. Forecasts of China-driven strength in commodity prices, therefore, are suspect. Additional weakness is more likely, based on an accelerating downswing in the global stockbuilding cycle, a key driver of commodity prices historically – chart 3.
Chart 3
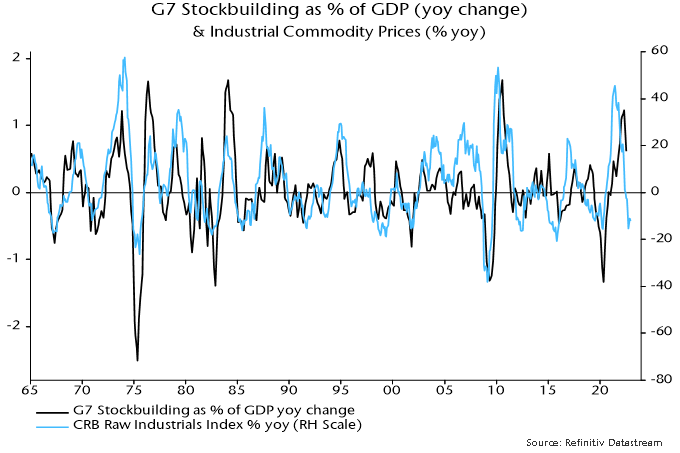
The 2021-22 inflation surge was a consequence of central banks applying record monetary stimulus in 2020 as the stockbuilding cycle was tracing out an extreme low. Monetary fuel supercharged the usual cyclical rise in commodity prices.
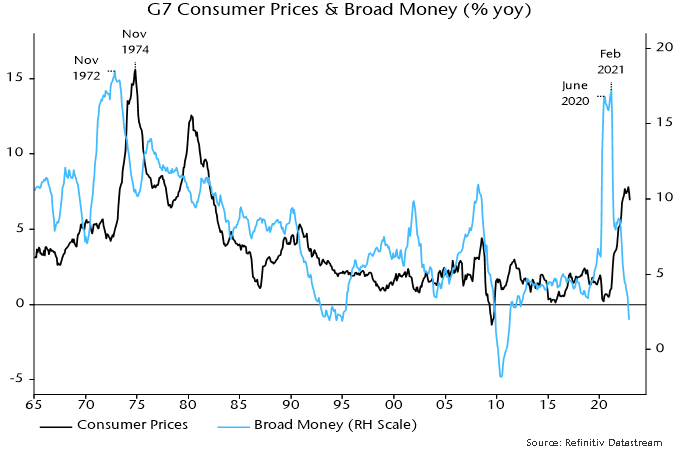
The monetary backdrop, like the status of the stockbuilding cycle, is now the opposite of 2020. G7 annual broad money growth crashed to 2.0% in November, below a pre-pandemic (i.e. 2015-19) average of 4.5% and down from a February 2021 peak of 17.3% – chart 4. The monetarist understanding of a roughly two-year lead implies an inflation crash from early 2023.
Chart 4
The latest trends, indeed, suggest rising medium-term deflation risk. G7 broad money contracted marginally in the three months to November. Bank loan growth to the private sector had been providing support but is now slowing as higher rates curb mortgage demand and corporate borrowing needs moderate with the stockbuilding downswing.
The weak economic outlook is, according to the monetarist view, of limited relevance for assessing equity market prospects, which will hinge instead on “excess” money developments.
Two global excess money proxies are followed here: the gap between six-month real narrow money and industrial output momentum; and the deviation of 12-month real money momentum from a long-term moving average. The first indicator turned negative in December 2021 (allowing for data reporting lags), with the second following in February 2022. Historically (i.e. over 1970-2021), global equities underperformed cash by 8.9% pa on average when both were negative. The underperformance between end-February and end-December 2022 was larger, at 14.9% pa.
As noted earlier, six-month real narrow money momentum has recovered slightly from a June low. Industrial output momentum, meanwhile, is estimated to have turned negative at end-2022, with further weakness likely. A cross-over, therefore, appears imminent and may even have occurred in December – chart 5. Allowing for the data reporting lag, a December cross-over would imply a shift in sign of the first indicator from positive to negative from end-February.
Chart 5
The second indicator – the deviation of 12-month real money momentum from a moving average – is heavily negative and unlikely to turn positive before mid-2023 at the earliest.
The expected combination of positive and negative readings of the first and second indicators respectively was historically associated with equities underperforming cash by an average 4.5% pa, suggesting retaining a cautious investment stance.
The combination could result in significant sector / style rotation: tech, quality and growth outperformed on average with value and energy underperforming. Non-energy defensive sectors would be expected to continue to outperform non-tech cyclicals. EM equities outperformed developed markets on average.
The suggestion of a reversal of growth underperformance in 2022 is consistent with indications that Treasury yields will decline during 2023 – surging yields contributed to the derating of growth stocks last year.
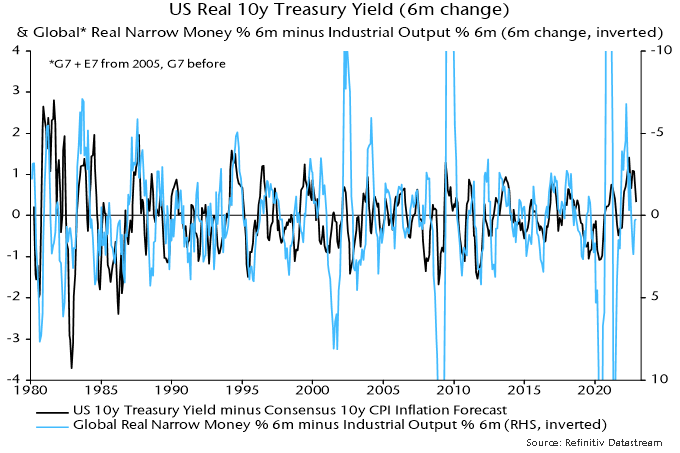
Equity markets are bullish or bearish depending on whether excess money is positive or negative. Bond markets, by contrast, are sensitive to the rate of change of excess money, rather than its sign. Changes in US real Treasury yields have been inversely correlated with changes in the first excess money measure historically, i.e. yields have fallen when the measure has risen, even while still negative – chart 6. The current / expected improvement in the measure, therefore, suggests an extension of the recent yield decline.
Chart 6
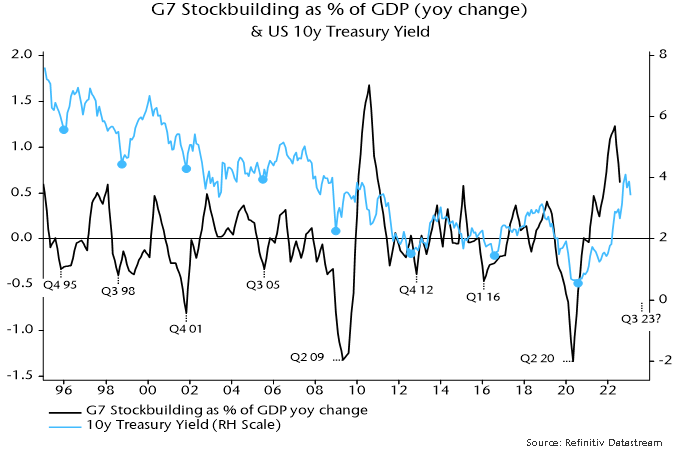
Treasury yields, in addition, usually move down into a low around the same time as the stockbuilding cycle trough – chart 7. Based on the average cycle length of 3 1/3 years, the next low could occur in Q3 or Q4.
Chart 7
A fall in Treasury yields requires a Fed policy “pivot” but this could be imminent. Chart 8 shows the estimated probability of the Fed tightening policy in a particular month based on the latest data on core inflation, unemployment and supply bottlenecks. The probability estimate fell from 100% in October to 80% in December and currently stands at 75% for the FOMC meeting on 31 January / 1 February, consistent with market speculation of a step down from a 50 to 25 bp hike.
Chart 8
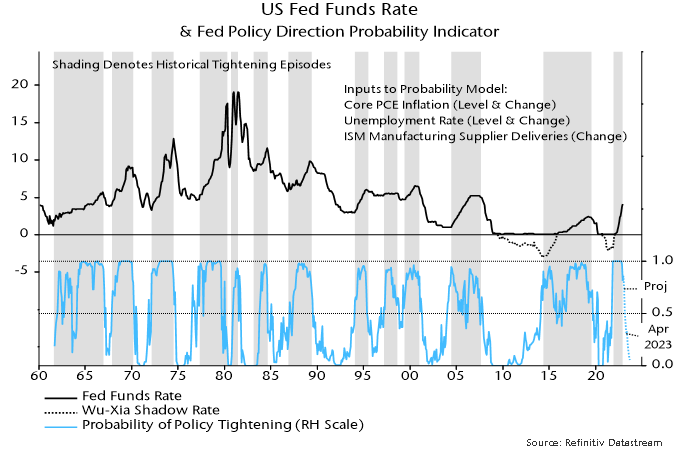
Based on the FOMC’s December median projections, the probability of tightening is forecast to fall below 50% in Q2 and below 10% in Q3. This outlook is consistent with the Fed shifting to an easing bias in Q2 and starting to cut rates in Q3.
 View Printer Friendly Version
 Email Article to Friend
Reader Comments (4)
Where is the rise in G7 & E7 real narrow money coming from ? It's not clear from the breakdown of countries. Is that because Russia is missing?
Taxpayers write checks from their bank accounts. If the Treasury puts those taxes in the TGA rather than spending them, they do not return to the banking system. From the end of 2021 to November 2022, the TGA grew from $134 billion to $524 billion. In other words, M2 was reduced by $390 billion because the Treasury held cash out of the system. This has slowed reported M2 growth and just maybe money isn’t as tight as it appears.
Another sign that money may not be as tight as it appears is that loans and leases at banks are up 12% in the year ending December even though M2 has not grown.
From the E7 - real money momentum rose between June and November across BRIC and Mexico.
Yes, the rise in the TGA balance has been an important factor depressing money growth. That doesn't mean that monetary weakness is artificial and won't have effects. The drag won't be repeated but now bank lending (lagging indicator) is slowing sharply, while QT continues - so it seems unlikely that money growth will bounce back significantly. Monthly growth in loans and leases fell to 5.2% at an annualised rate in December and is probably heading much lower.
It does look like the monetary signals incorrectly warned for a steep recession in the eurozone at the start of 2023(see FT today 23/01). Do you consider this optimism unwarranted or have external factors (government support and lower gas prices) distorted the monetary signals?