Has the Fed been misled by faulty payrolls data?
US non-farm payrolls have risen by an average of 337,000 per month in the eight months since the Fed started hiking rates in March. The household survey measure of employment was essentially flat over this period.
The gap between the eight-month changes in the two series is at a record high, excluding April-May 2020 when data were distorted by the pandemic*. (This comparison, however, uses revised data for the two series.)
The payrolls numbers have informed the FOMC’s judgement that “job gains have been robust”, in turn influencing the magnitude of the rise in rates this year.
The payrolls survey covers about 670,000 worksites, while the household survey has a sample size of about 60,000. Sampling error, therefore, is larger for the household survey – the standard error of the monthly change in the household survey employment measure is more than four times that of the monthly payrolls change, according to the BLS.
The payrolls survey, therefore, is conventionally regarded as the more reliable gauge of short-term employment movements.
A focus on monthly sampling error, however, ignores sometimes large revisions to the payrolls data due to annual benchmarking against unemployment insurance tax records. There is no comparable annual revision to historical household survey data.
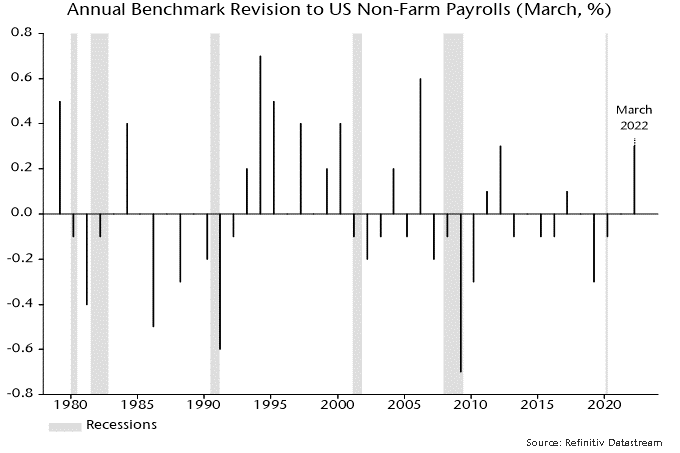
The annual payrolls revisions have averaged close to zero over the long run but there have been clusters of negative revisions around recessions – see chart 1.
Chart 1

Benchmark revisions occur with a long lag. The BLS in August issued a preliminary estimate of a 462,000 upward revision to the March 2022 level of payrolls. This will be incorporated in monthly historical data up to March 2022 in February 2023.
Benchmark revisions to recent monthly data, therefore, will occur in February 2024 under current BLS practice.
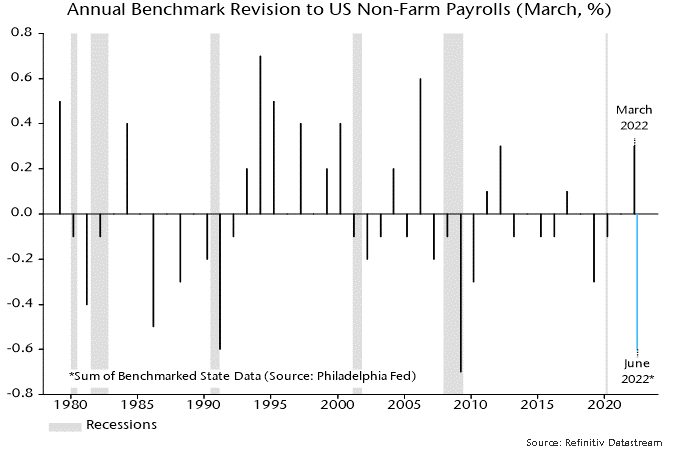
Research by the Philadelphia Fed suggests that these revisions will be negative and potentially very large. The researchers have attempted to replicate the annual BLS benchmarking procedure using quarterly UI records. They estimate that the currently-reported level of payrolls in June 2022 of 151.9 million will be revised down by 843,000, or 0.55% – chart 2.
Chart 2

This would imply that payrolls grew by only 3,500 per month on average between March and June compared with the currently-reported 349,000.
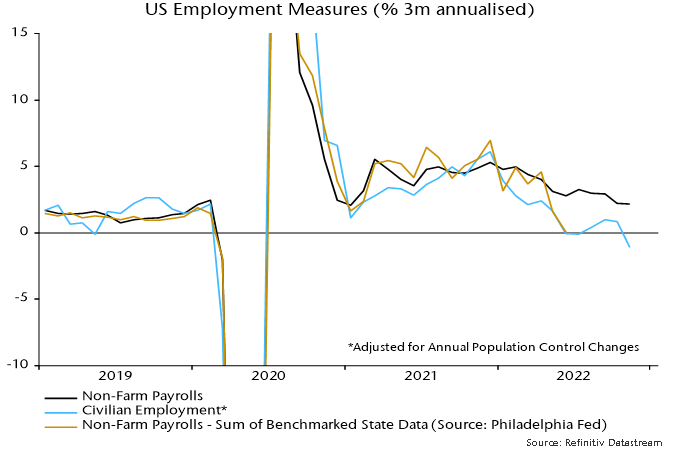
Chart 3 compares three-month growth rates of the official payrolls series, the household survey employment measure and the Philadelphia Fed benchmarked payrolls series. The May / June readings of the latter two are equal.
Chart 3

The official payrolls measure has risen by an average of 329,000 per month in the five months since June. Monthly gains in the household survey employment measure averaged 72,000 over this period.
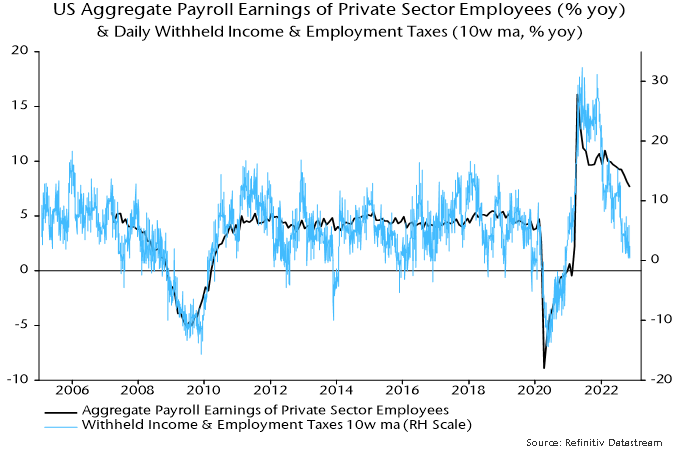
A benchmarked payrolls estimate for September won't be available until March but timely data on withheld income and employment taxes – including UI taxes – suggest that the official payrolls series has continued to overstate gains. The daily tax data are noisy but year-on-year growth of a moving average has fallen sharply since June, widening an undershoot of the normal relationship with aggregate private sector earnings growth from the payrolls survey – chart 4.
Chart 4

*The payrolls series measures jobs while the household survey measures people. The wide gap partly reflects a rise in the number of people with multiple jobs. A BLS research series is available that attempts to convert household survey employment data to a payrolls concept, including by adding multiple jobs. This series rose by an average of 103,000 per month in the eight months to November. The difference with payrolls growth is also a record excluding 2020 data.

Reader Comments (1)
Thanks for your economic insights this year. It looks like 2023 can be quite a difficult one economically but certainly interesting for economists.