Has the Fed called the top in growth (again)?
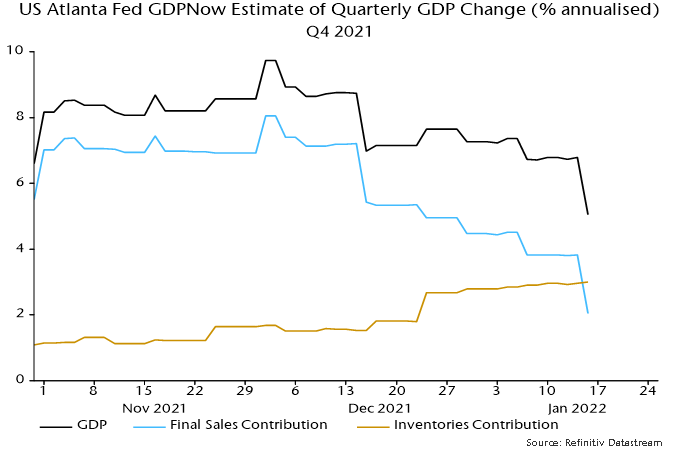
Recent US economic news has surprised negatively when properly weighted for significance. The Atlanta Fed’s nowcast of the contribution of final sales to Q4 annualised GDP growth has been slashed from 8.1 percentage points at the start of December to just 2.0 pp currently – see chart 1.
Chart 1

The most recent lurch down was driven by shockingly bad December retail sales – inflation-adjusted sales have now dropped 10% from their stimulus-inflated March peak.
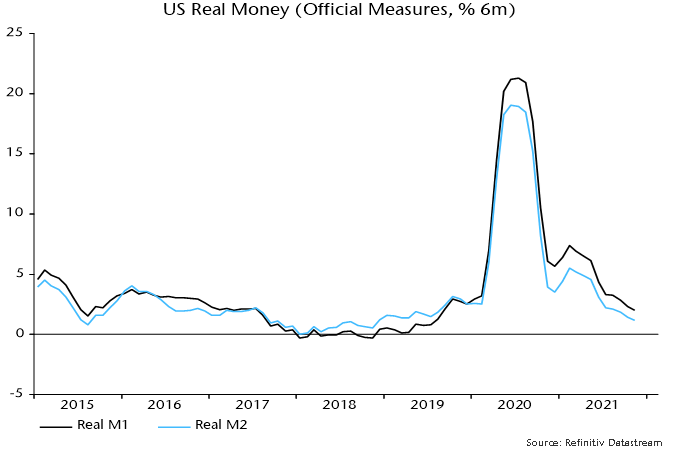
The consensus is discounting weakness as temporary and due to the omicron wave. The “monetarist” forecast is that a cyclical slowdown is under way related to a big fall in real money growth since 2020 – chart 2.
Chart 2

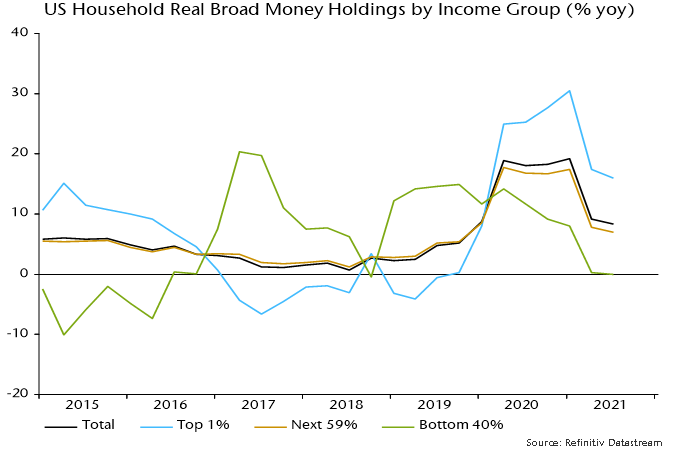
The distribution of money growth, moreover, looks unfavourable for demand growth. Broad money balances have risen fastest for high-income households with a lower propensity to consume. Money holdings of the bottom 40% of earners were stagnant in real terms in the year to end-Q3 – chart 3.
Chart 3

The Atlanta Fed’s Q4 GDP growth nowcast is still up at 5.0% but this reflects a whopping 3.0 pp contribution from inventories – consistent with the view here that the stockbuilding cycle is peaking.
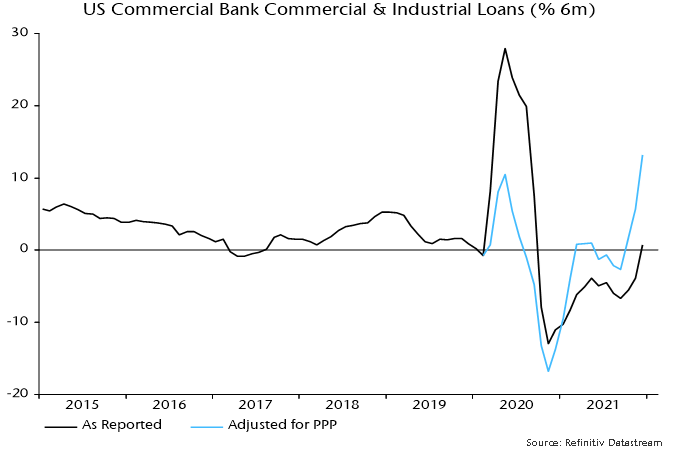
The latter estimate is based on inventory data through November but the December retail sales slump suggests further stockpiling. So does another bumper monthly rise in commercial and industrial loans, which are strongly influenced by inventory financing needs – chart 4.
Chart 4

The Fed’s “hawkish pivot” was predicated on a strong economy* but the Fed is often facing the wrong way at turning points. Officials are likely to row back if activity data continue to disappoint, even if inflation news remains unfavourable.
*From Chair Powell’s testimony to the Senate Banking Committee on 11 January: ”Today the economy is expanding at its fastest pace in many years, and the labor market is strong.”

Reader Comments (4)
Simon,
Thank you for the great post.
You are suggesting that the stockbuilding cycle is peaking right now as opposed to prior data suggesting it was peaking mid year 2021.
Would that mean then that the low on the stock building cycle will be delayed to Q3/Q4 2023 ?
Hi Simon, thanks for the post. Is the official M1 data you use here available from the Fed as a series or have you continued to make your own adjustments to the series since the changes in 2020?
Best,
Mark.
QDB - Stockbuilding cycle peaks don't typically occur exactly at the mid-point between lows. The timing of the peak isn't informative for trying to date the next low. I still think that the current cycle could be shorter than average (because the previous one was longer), suggesting a low around mid-2023.
Mark - This is M1 on the new definition, which includes savings deposits. Data from May 2020 are from the Fed; earlier numbers were obtained by adding savings deposits to the old M1. My preferred narrow money measure (not referenced in the post) was / is M1A (currency in circulation plus demand deposits), to which I'm continuing to apply an adjustment (specifically, I assume that demand deposits would have grown at the same rate as the deposit component of the new M1 measure in the absence of the 2020 changes).
Many thanks.