Equities / cash switching rules: an update
Previous posts (last one here) discussed two rules for switching between global equities and US dollar cash based on monetary signals. The rules are currently giving opposite recommendations. Historically, the opportunity cost of holding cash has been low, on average, under such circumstances.
The simple idea underlying the rules is that “high” (to be defined below) global money growth is likely to be associated with rising demand for equities and other financial assets, with corresponding upward pressure on prices. Conversely, low or falling money growth may signal selling and downward pressure.
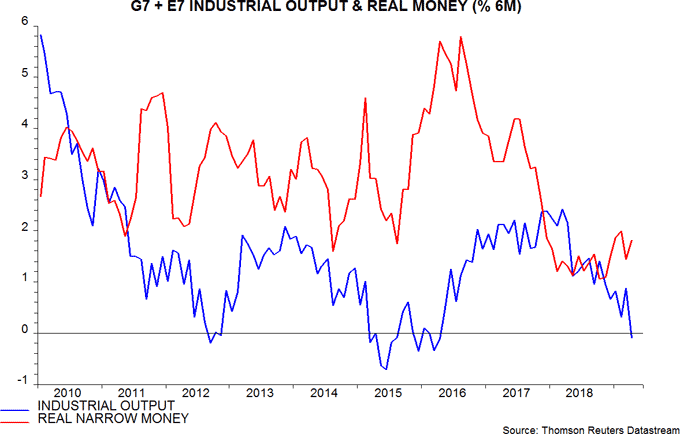
The first rule generates positive or negative signals by comparing six-month rates of change of global* real narrow money and industrial output. A positive differential suggests that money holdings are rising faster than needed to support economic expansion, implying a surplus to be invested in markets.
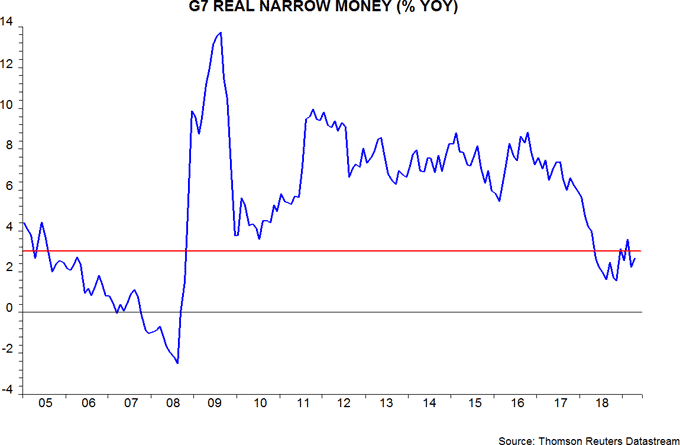
The second rule recommends equities unless G7 annual real narrow money growth falls below 3% – its average from 1970 until the 2008-09 recession / crisis.
The rules take into account data reporting lags and switching takes place at end-month. The first rule incorporates a three-month lag, e.g. the recommended asset allocation for May, implemented at end-April, depends on monetary / industrial output data for February. The lag is two months for the second rule because it relies only on monetary data, which in most countries are available by the end of the following month.
Both rules would have outperformed equities significantly over the long term – unsurprisingly, given that their formulation was informed by historical evidence.
The second rule has performed favourably in 2018-19. On an end-month basis, global equity markets, as measured by the MSCI World index in US dollars, peaked in January 2018. Equities underperformed dollar cash by 1.3% between January 2018 and April 2019 and suffered a maximum relative drawdown of 14.6% in December 2018. The second rule outperformed cash by 0.8% over this period, with a maximum drawdown of 6.4%.
The first rule, by contrast, has been disappointing. It underperformed cash by 3.6% over the period, with a maximum drawdown of 10.4%, i.e. only modestly smaller than for holding equities throughout.
This disappointing performance reflects the longer reporting lag incorporated in the rule, which resulted in several “whipsaws”. If the rule could have been implemented with a two-month lag, as with the second rule, it would have performed impressively, outperforming cash by 21.5% between January 2018 and April 2019, with no drawdown relative to the January starting point.
This raises the possibility of trying to reduce the lag to two months by estimating global industrial output for the latest month. Countries accounting for a combined weight of about two-thirds in the output aggregate release data by the end of the following month, so such an approach is feasible and likely to be reliable in most months.
What are the current recommendations of the two rules? The second rule switched from equities into cash at end-April because G7 annual real narrow money growth fell back below 3% in March – see first chart. Available data suggest that growth remained below 3% in April, so the rule is likely to recommend cash again at end-May.

The gap between six-month rates of change of global real narrow money and industrial output was positive in February and March, and is likely to have widened further in April, based on US / Chinese output data – second chart. The first rule, therefore, recommended equities at end-April and will do so again at end-May – regardless of whether the recommendation is based on actual March numbers or April estimates.

Historically, the excess return on equities relative to cash averaged only 0.9% per annum when the two rules gave conflicting recommendations, compared with 16.3% when both recommended equities. The opportunity cost of holding cash under such circumstances, in other words, was modest, on average.
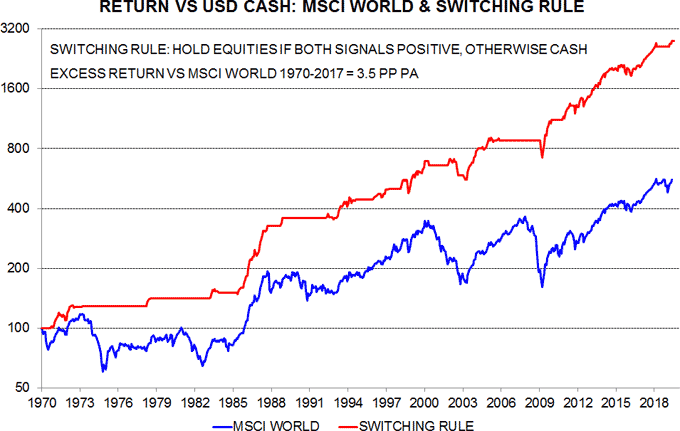
It is, of course, possible to combine the two approaches in a single “conservative” rule that recommends equities only if both monetary inputs are positive. The long-term return on such a rule would have been only marginally lower than for the two individual rules, with a smaller maximum drawdown – the third chart shows a comparison with buy-and-hold. This rule outperformed cash by 1.8% between January 2018 and April 2019, with a maximum drawdown of 4.2%.

*”Global” = G7 plus emerging E7. G7-only data used before 2005.

Reader Comments