Global industrial weakness intensifying as Kitchin / Juglar downswings accelerate
US and Chinese April industrial output figures released yesterday undershot expectations, confirming that global industrial activity continues to weaken alarmingly.
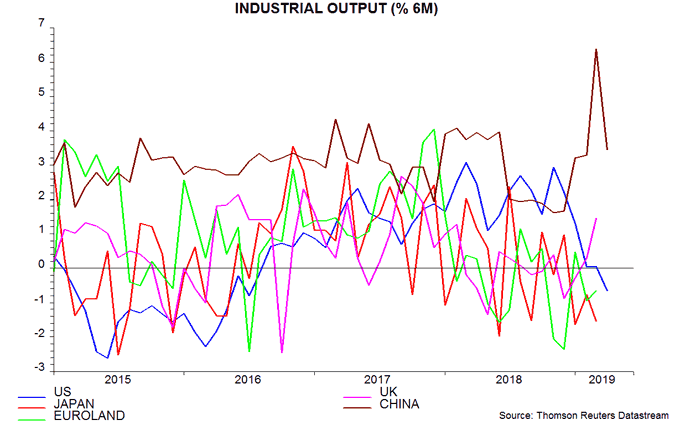
Six-month growth of Chinese industrial output reversed its March spike, confirming that the latter was driven by New Year timing and VAT cut anticipation effects rather than underlying acceleration. US output, meanwhile, posted a shock 0.5% month-on-month fall, with numbers for earlier months revised lower. The six-month decline in output in the US is now on a par with Euroland – see first chart.
The anomalous rebound recently in UK industrial / manufacturing output momentum reflects Brexit-related stockpiling and is likely to reverse sharply.
The US and China have a combined 50% weighting in the G7 plus E7 industrial output aggregate tracked here. Unless output in the rest of the grouping rose by more than 0.5% month-on-month in April (unlikely), the six-month change in the aggregate will turn negative.
The expectation here has been that the six-month change in G7 plus E7 output would bottom around July, based on an October 2018 low in real narrow money growth and an average nine-month lead. The Chinese March output spike, however, has created a significant negative base effect for the six-month change in September 2019, suggesting that the low may be reached in that month.
Industrial weakness, according to the analysis here, reflects joint downswings in the Kitchin stockbuilding and Juglar business investment cycles, both of which are judged to have reached peaks in late 2018. A reasonable expectation, based on their historical lengths, is that the two cycles will bottom in the third and fourth quarters of 2019 respectively but these timings are subject to review in light of incoming evidence. The escalating US / Chinese trade war will further dampen business “animal spirits” and may extend and deepen the Juglar downturn.
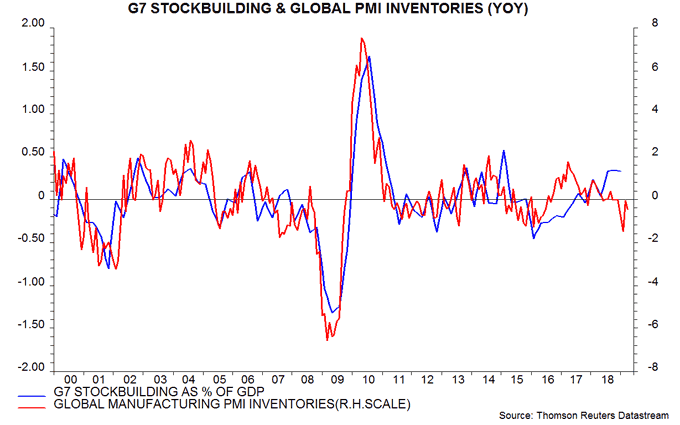
An indication of the Kitchin cycle reaching bottom would be extreme negative readings for several months in the year-on-year change in an average of the global manufacturing PMI inventories indices for finished goods and purchases. This indicator spiked lower in February but rebounded in March and was only moderately negative in April, suggesting that the cycle downswing has yet to reach maximum intensity – second chart.


Reader Comments