2016 replay?
Claims are being made that current economic / market conditions resemble those in early 2016.
The MSCI All-Country World Index (ACWI) fell by 20.2% in US dollar terms between May 2015 and February 2016 as the global economy slowed significantly, with the manufacturing PMI dropping to 50.0. Activity and equities, however, rebounded strongly over the remainder of 2016 as policy stimulus boosted the Chinese economy and the Fed paused rate hikes for 12 months.
The ACWI index fell by a slightly larger 20.7% from a January 2018 high to the Christmas low, while the manufacturing PMI weakened to 51.5 in December, with early flash results suggesting a further decline this month. Chinese policy-makers are easing again and markets are discounting only a 15% chance of a Fed rate rise this year, according to the CME FedWatch tool (as of yesterday).
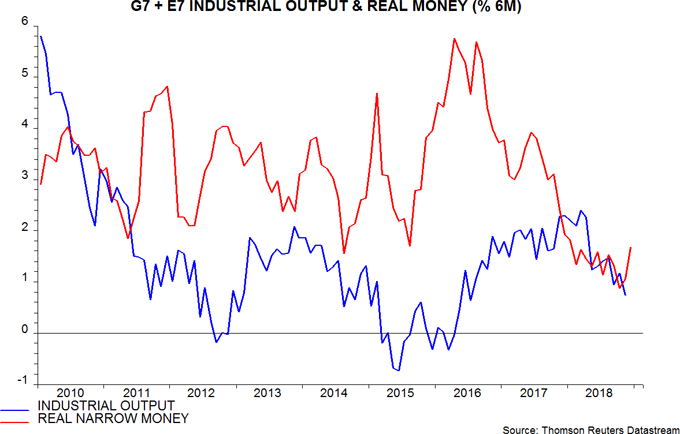
Commentaries here were positive about economic / market prospects in the first half of 2016 but current conditions differ in two important respects. First, global monetary trends are much weaker. Six-month growth of G7 plus E7 real narrow money bottomed in August 2015 and was moving up to a double-digit annualised pace as the equity market rally started in early 2016. Real money growth may have bottomed in October 2018 but a significant recovery has yet to unfold – first chart.

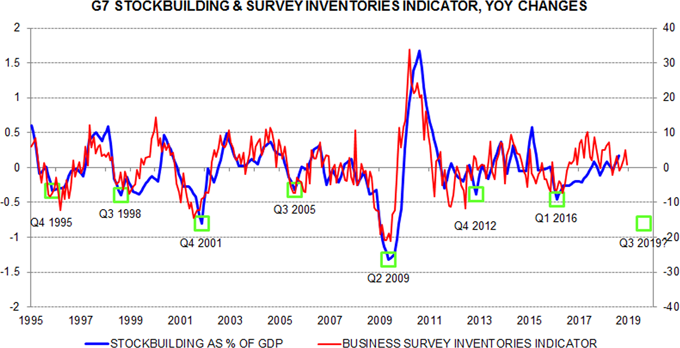
Secondly, the G7 stockbuilding or inventory cycle was bottoming out in early 2016 but – on the assessment here – is currently in the early stages of a downswing, which may extend into the second half of 2019.
A key cycle gauge is the annual change in G7 stockbuilding expressed as a percentage of GDP. This was still moving higher in the third quarter of 2018, the most recent data point, consistent with the cycle approaching a peak. It was, by contrast, significantly negative in the first quarter of 2016, having topped a year earlier – second chart.

Business surveys provide a cross-check of the national accounts stockbuilding data and are more timely. As the chart shows, the annual change in a G7 survey-based indicator remained positive in December, supporting the assessment that the bulk of the cycle downswing lies ahead.
If the recent recovery in global real narrow money growth were to be sustained during the first half of 2019, and assuming that the current stockbuilding cycle is of average length (3.5 years), conditions could resemble those in early 2016 sometime during the second half of the year. A sustained monetary pick-up probably requires, at a minimum, the Fed to suspend “quantitative tightening”. Markets may have to weaken further to prompt such a shift.

Reader Comments