Why have Treasury yields risen?
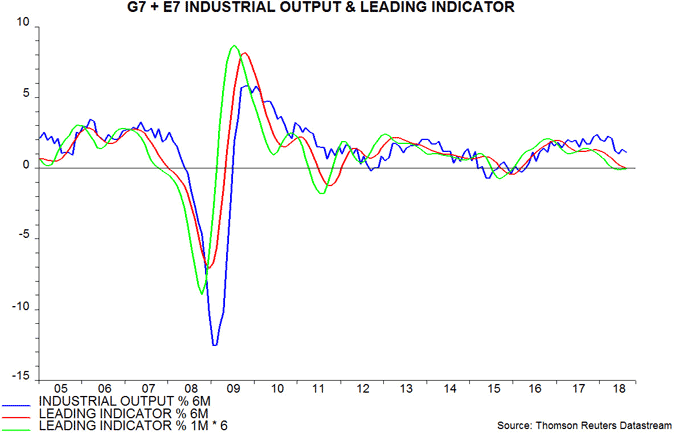
The long-standing forecast here has been for global economic momentum – as measured by the six-month rate of change of industrial output in the G7 economies and seven large emerging economies – to fall into late 2018 and remain weak in early 2019. Incoming news is consistent with this forecast. The global PMI manufacturing new orders index, for example, was reported last week to have declined further in September, with export orders now in contraction territory – see first chart.

The OECD yesterday released August data for its country composite leading indicators, allowing an update of the global (G7 plus E7) leading indicator tracked here. The six-month rate of change of this measure fell again, consistent with a further economic slowdown into late 2018 – the indicator typically leads by four to five months. The one-month change, however, has stabilised recently, suggesting that downward pressure is starting to ease, although confirmation is required – second chart.

Why, then, did US Treasury yields break higher last week? Yields typically fall during global economic slowdowns. Are Treasuries looking through current weakness and sniffing another pick-up in growth from early 2019, with associated inflationary risks?
Such a pick-up, on the view here, is unlikely without a prior rise in global real narrow money expansion, which remained soft through August. With monetary policies tightening or on hold in most economies, it is not obvious why money trends should strengthen.
The exception, of course, is China, where recent easing steps – including an addition large cut in bank reserve requirements announced over the weekend – raise the possibility of a monetary rebound. September money data due shortly will be important but the suspicion here is that the authorities are “behind the curve” – see previous post. Reserve injections, moreover, may serve mainly to boost capital outflows.
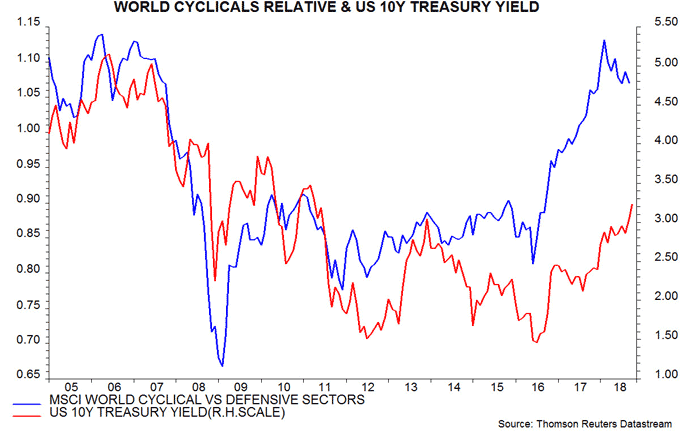
Equity market behaviour appears inconsistent with the notion that Treasury yields are being pushed higher by rising economic optimism. Yield increases in 2012-2013 and 2016-early 2018 were accompanied by rising equity markets and outperformance of cyclical sectors. Now, equities are struggling and cyclical sectors fell further relative to defensive sectors last week – third chart.

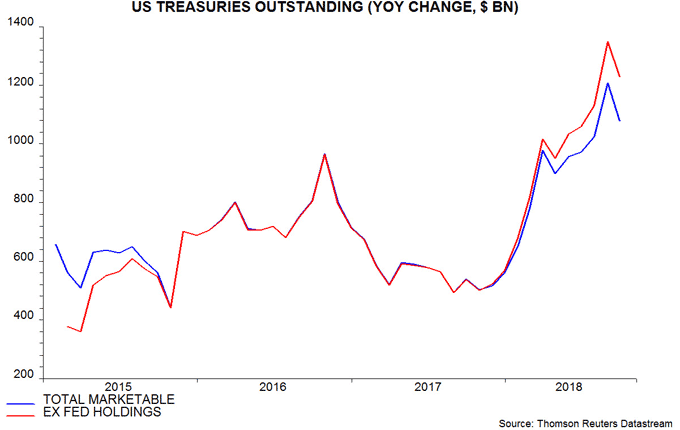
The yield rise may reflect the weight of official Treasury supply rather than reduced demand due to stronger economic / inflation expectations. The outstanding stock of marketable Treasury securities rose by $1,078 billion in the 12 months to September, with the portion held outside the Fed up by $1,230 billion – fourth chart. The former increase is significantly higher than the federal deficit – $890 billion in the 12 months to August, the latest available month – because the Treasury issued additional debt to fund an increase in its cash balance at the Fed.

Supply to non-official holders is also being boosted by currency intervention by foreign monetary authorities attempting to contain dollar strength. Chinese official reserves fell by $23 billion last month, with most of this decline likely to reflect intervention rather than valuation changes.
Rises in Treasury yields accompanied by underperformance of cyclical equity market sectors also occurred briefly in 2006, 2007 and 2008 – third chart. On the first occasion, yields fell back and cyclicals rallied; in the latter two cases, both yields and the cyclicals / defensives ratio declined.
Until global money trends suggest an end to the current slowdown / weak growth phase, the rise in Treasury yields will be interpreted here as an additional reason for caution about equity market prospects.

Reader Comments