A "monetarist" perspective on current equity markets
2017 was a bumper year for global markets because economic growth strengthened, core consumer price inflation flatlined and the monetary environment remained accommodative despite Federal Reserve policy tightening. Prospects for 2018 are less favourable in all three respects.
We expect the global economy to remain strong in early 2018 but to slow as the year progresses. This reflects two considerations. First, global six-month real narrow money growth peaked in June 2017 and fell significantly through November. Real money trends typically lead economic activity by between six and 12 months – we found an average lead time of nine months at growth turning points in G7 data extending back to the 1960s. This suggests that global six-month industrial output growth will peak around March 2018 and subside through August, at least – see first chart.

Secondly, an upswing in the US / global stockbuilding cycle has been an important driver of recent economic strength but we expect the cycle to top out in the first half of 2018 and act as a drag on growth later in the year and in 2019.
The original research into this cycle (by British economist Joseph Kitchin) indicated an average length of 40 months (i.e. measured from peak to peak or trough to trough). Consistent with this, the contribution of stockbuilding to the annual change in G7 GDP has reached a trough every 13-14 quarters on average over the past 20 or so years – second chart. The last trough occurred in the first quarter of 2016 and the growth contribution turned positive in the third quarter of 2017, the latest data point.
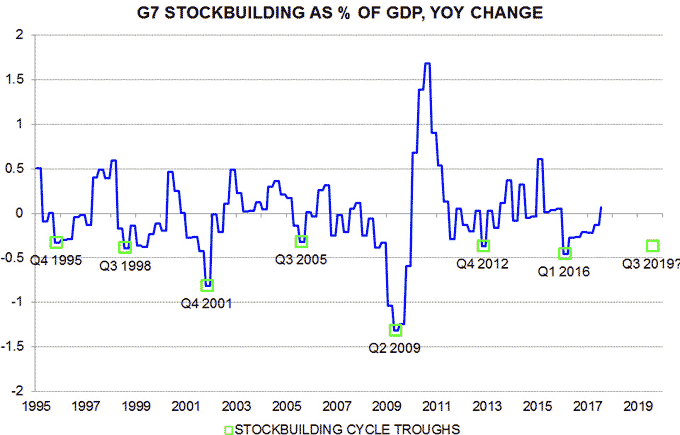
With the upswing nearly two years old, the cycle may be close to a peak, based on its average historical length. We expect the GDP growth contribution to rise further into early 2018 but to fade later in the year and turn negative in 2019 ahead of the next cycle trough.
Will US fiscal stimulus head off the economic slowdown suggested by monetary trends and the stockbuilding cycle? We are doubtful: while opinions vary widely, economists on average expect an impact on US GDP growth in 2018 of about 0.4%, which would suggest a marginal influence on global prospects.
As well as solid economic growth, strong market performance in 2017 reflected stable core (i.e. ex. food and energy) consumer price inflation and resulting limited monetary policy tightening. Central banks may face a greater inflation challenge in 2018.
G7 core producer price inflation has picked up over the past 18 months as firms have passed on rising input costs and widened margins in response to strong demand. Core producer price trends often lead consumer prices – third chart.

Growing labour shortages, meanwhile, threaten to boost wage growth and slow productivity performance. In the US, the unemployment and job openings (vacancies) rates have almost converged, a rare occurrence historically that has always presaged a pick-up in unit labour cost growth.
Labour markets are also tight in Germany, the UK and particularly Japan, where the job openings rate has opened up the largest gap with the unemployment rate since 1974.
A rise in unit labour cost growth would push up core inflation unless firms took the hit on margins. Central banks would probably need to accelerate policy tightening to force them to do so.
China could be an exception to a general trend towards tighter monetary policies in the first half of 2018. The authorities have already moved to a modestly restrictive stance and annual narrow money growth has fallen significantly since late 2016. Money trends lead house prices, suggesting that the latter will slow further in early 2018 – fourth chart. Monetary policy was eased on the last three occasions that annual house price inflation fell to zero.
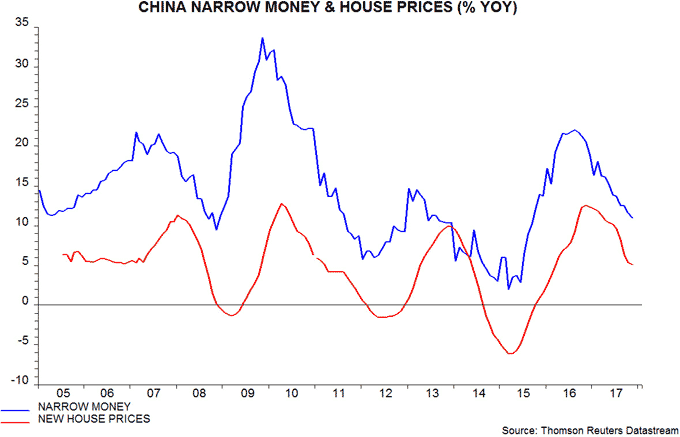
Any policy reversal in China could give a further short-term boost to commodity prices, which would add to global inflation concerns.
In addition to expecting a less favourable growth / inflation mix in 2018, we judge that monetary conditions are no longer conducive to asset price appreciation. Our historical research found that bouts of equity market weakness were usually preceded by G7 annual real narrow money growth falling below its long-run average of about 3% or declining sharply (i.e. by 3 percentage points within six months). A strategy of switching into cash under such conditions would have significantly outperformed buy-and-hold – fifth chart.

G7 real narrow money growth has fallen moderately since late 2016 but remains well above the 3% long-run average – neither condition, therefore, has yet been satisfied. G7 trends, however, are no longer an adequate proxy for global monetary conditions, given the growing weight of China and other emerging economies. Our global annual real money growth measure peaked at nearly 10% in late 2016 and recently fell below its long-run average of about 6%. The monetary backdrop for equities and other risk assets, therefore, may be neutral at best.
Two further reasons for a more defensive stance are slowing QE and the historical correlation of market returns with the stockbuilding cycle. The 12-month running total of purchases of government and agency securities by the G4 central banks peaked in March 2017 and will fall steeply in 2018, based on announced plans – sixth chart. This slowdown could weaken monetary trends, while prior declines in 2010 and 2014 preceded equity market set-backs.

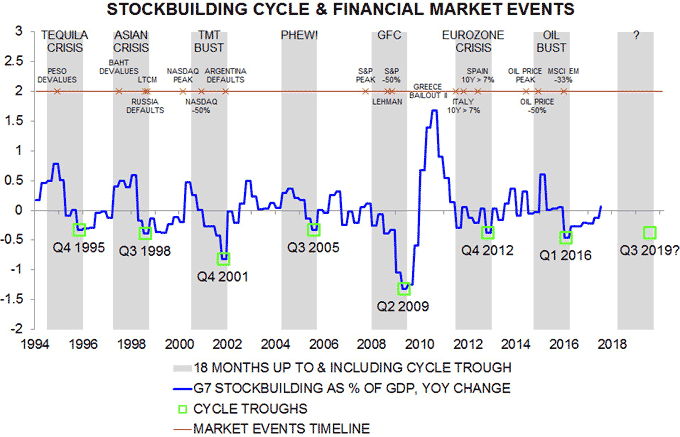
The position of the stockbuilding cycle, meanwhile, appears to be an important indicator of market environment, according to our research. Markets tend to be in “risk-on” mode during the cycle’s upswing phase but the 18-month period leading up to a trough is often characterised by selective or general asset price weakness and “crises” – seventh chart. Assuming that the current cycle is of average length, another 18-month “dark” period may begin in the first half of 2018.
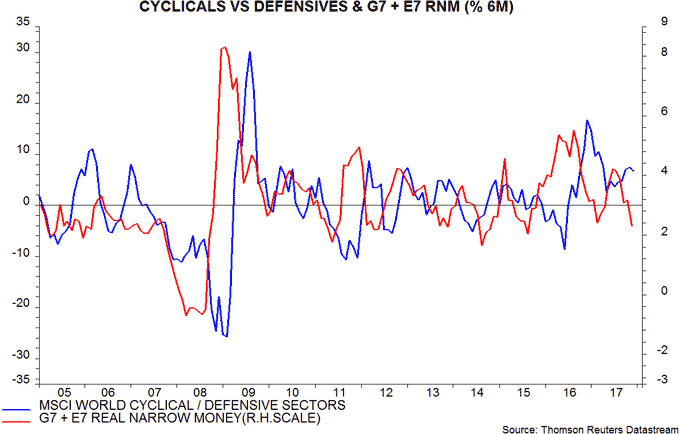
MSCI World cyclical equity market sectors outperformed defensive sectors by 30% between mid-2016 and end-2017. Outperformance is normal during stockbuilding cycle upswings but defensives usually regain ground during the downswing phase. The recent fall in global real narrow money growth also argues for increasing defensive sector exposure – eighth chart.
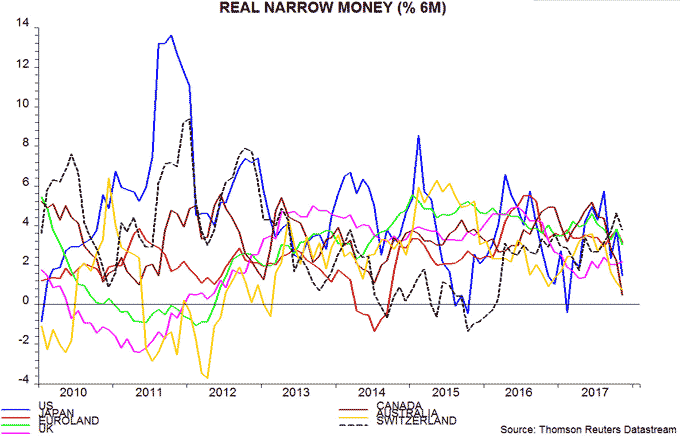
Real money growth has declined in the US and Euroland as well as China, and is particularly weak in Canada and Australia; it has strengthened in Switzerland, moved sideways in Japan and recovered slightly in the UK – ninth chart. This suggests adding to equity market exposure in the latter three markets while reducing the former group.
E7 real narrow money growth was above the G7 level in 2016 / early 2017, arguing for an overweight position in emerging markets, but the latest numbers are similar. Emerging equities typically underperform during the downswing phase of the stockbuilding cycle.

Reader Comments