Global slowdown under way, latest money data slightly better
The view here since late 2016 has been that global economic momentum would slow from a peak in spring 2017. The latest monetary information suggests a renewed acceleration from late 2017, although this requires additional data confirmation. The near-term slowdown is not expected to reverse recent labour market tightening so is unlikely to deflect the Fed and other central banks from continuing to rein back stimulus. This suggests a difficult backdrop for markets.
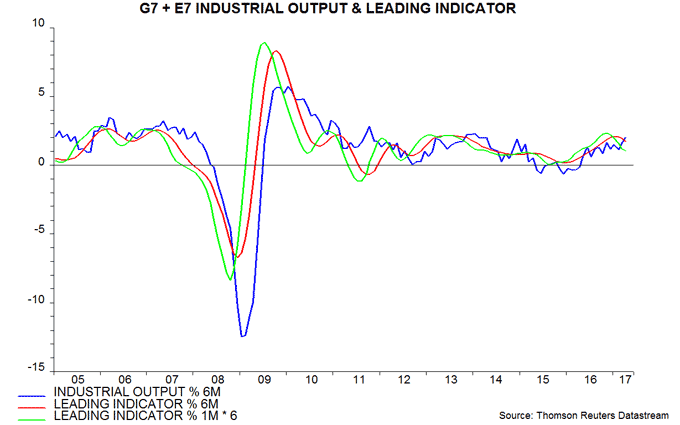
Based on partial data, six-month growth of global industrial output is likely to have risen further in April to its highest level since 2014 (“global” = G7 plus “E7” large emerging economies). Growth may decline in May, reflecting an unfavourable base effect from a large monthly output rise in November 2016. An April peak in six-month growth would be consistent with global real narrow money trends: six-month real money expansion peaked in August 2016 and has led output growth turning points by an average of nine months historically – see first chart.
Real money growth, adjusted to smooth the effect of India’s demonetisation programme, fell into February 2017, suggesting that the economic slowdown will extend into late 2017. It recovered, however, in March, with partial April data indicating a further increase. If confirmed and followed by a third successive rise in May, the view of six-month-ahead economic prospects here will shift from downbeat back to upbeat.
Markets are unlikely to start discounting a year-end pick-up for several more months. Softer economic and earnings news may dominate near term. The prospect of a summer slowdown has been confirmed by the global leading indicator tracked here, one-month growth of which appears to have fallen for a fifth successive month in April, based on preliminary calculations – second chart. (To recap, the global leading indicator is derived from the OECD’s country leading indicators and has led industrial output by four to five months on average historically.)
Business surveys, which provide little if any lead on industrial activity (though are more timely), are starting to cool on schedule. A global survey indicator combining responses on new orders or output expectations, mostly for the industrial sector, fell in April for the first time since August 2016, mainly reflecting a softer US ISM – third chart.
Major central banks are optimistic about economic prospects and concerned about inflationary risks from tight labour markets – the G7 unemployment rate is at its lowest level since 1980. They are likely, therefore, to be slow to respond to softer near-term data. Weaker economic / earnings news with an absence of offsetting policy support could challenge current equity market valuations. Yields on Treasuries and other government bonds, meanwhile, may be underpinned by QE wind-down, worries about US fiscal laxity and possible end-2017 economic reacceleration.

Reader Comments (1)
Please continue to post your observations and indications of possible outcomes. Very useful and refreshing to read such concise evidence based comment. Thank you.
A Private Investor.