UK data wrap: positive current account surprise
UK monthly sectoral output numbers suggest that quarterly GDP growth will slow to 0.4-0.5% in the first quarter from 0.7% in the fourth quarter. GDP price data, meanwhile, confirm a pick-up in domestic inflationary pressures, with the annual rise in the GDP deflator unrevised at 2.8% in the fourth quarter. The current account deficit fell sharply last quarter, reflecting stronger trade performance in both goods and services and a further fall in net income paid abroad.
Highlights of today’s batch of data releases include:
-
GDP fell by 0.2% between December and January to stand 0.3% above the fourth-quarter level. The decline spanned sectors, with services, industrial and construction output down by 0.1%, 0.4% and 0.4% respectively. The soft start to the quarter suggests downside risk to the Bank of England staff “nowcast” of 0.6% growth in the first quarter at the time of the March MPC meeting.
-
Services output growth in the third and fourth quarters was revised down slightly, resulting in a reduction in third-quarter GDP expansion from 0.6% to 0.5% with fourth-quarter growth unchanged at 0.7% rather than revised up (as earlier data had suggested).
-
The 2.8% annual rise in the GDP deflator in the fourth quarter was the strongest since 2008. The gross value added deflator – which excludes indirect taxes and subsidies – was up by 2.6%. Measured from the income side, employee compensation per unit of output rose by 2.3%, while the unit contribution of profits, rents and other income was up 3.1%. These numbers confirm that the current inflation pick-up has a significant domestic element.
-
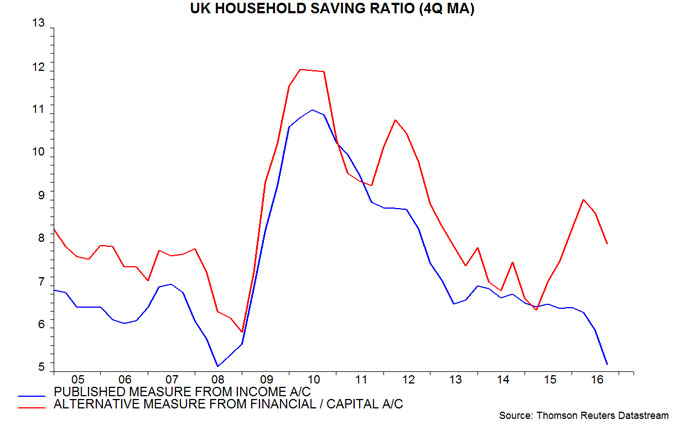
The official measure of the household saving ratio fell to 5.2% in 2016 and 3.3% in the fourth quarter, a record low in data extending back to 1963. An alternative measure of the saving ratio derived from the financial / capital accounts remains significantly higher than the official series, giving a more favourable impression of consumer finances, but also declined last year – see first chart below and previous post for more details.
-
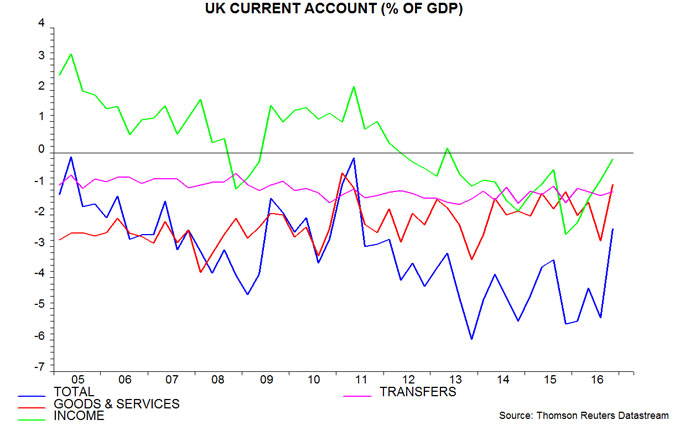
The current account deficit fell from 5.3% of GDP in the third quarter to 2.4% in the fourth, reflecting a smaller trade shortfall in goods and services and a further decline in the income deficit to the lowest since 2013 – second chart. The services trade surplus matched a previous record 5.4% of GDP last quarter as exports – particularly to non-EU countries – continued to grow robustly. The recent decline in the income deficit has been driven by a strong recovery in foreign direct investment earnings probably mainly due to the translation effect of sterling weakness and higher oil prices / profits – fourth-quarter earnings were up by 64% from a year earlier.
-
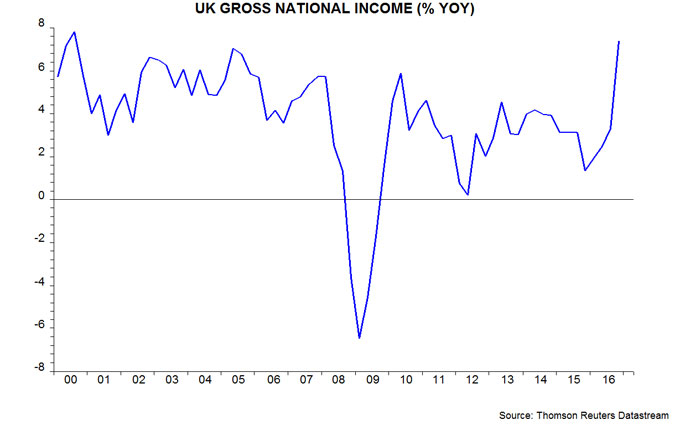
The combination of solid output expansion, accelerating domestic prices and a big decline in net income paid abroad resulted in gross national income surging by 7.4% in the year to the fourth quarter, the strongest annual increase since 2000 – third chart.


Reader Comments