US corporate finances unpromising for business spending
US corporate profits weakened in the fourth quarter of 2016, casting doubt on expectations that business spending will drive a pick-up in economic growth.
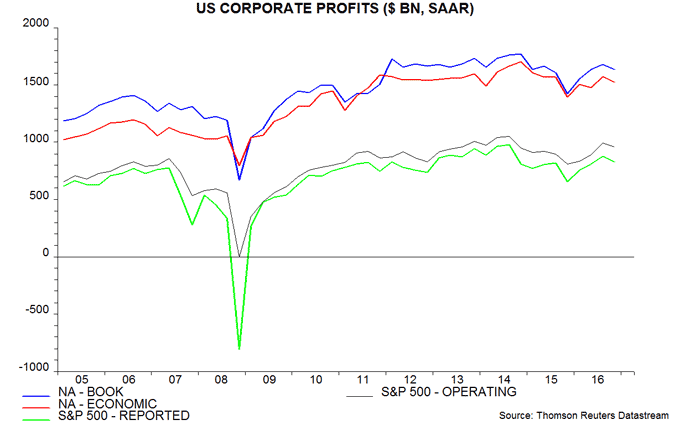
Fourth-quarter financial accounts released by the Federal Reserve on 9 March contain the first official estimate of corporate profits calculated on a national accounts basis. Both headline profits and an “economic” measure that adjusts for stock appreciation and over- / under-depreciation fell between the third and fourth quarters. Economic profits were 11% below a peak reached in the fourth quarter of 2014 – see first chart.
These numbers may be revised in the “final” GDP report for the fourth quarter to be released on 30 March. As the chart shows, however, the quarterly decline in the national accounts profits measures tallies with S&P data on the aggregate reported and operating earnings of S&P 500 companies.
Bullish commentary may have been influenced by a sharp rise in year-on-year S&P 500 reported earnings per share (EPS) growth – from 9% in the third quarter to 29% in the fourth, according to S&P – but this is entirely explained by a favourable base effect due to EPS falling by 19% between the third and fourth quarters of 2015.
The profits measures in the first chart tend to lead the consensus 12-month forward S&P 500 EPS estimate. The fourth-quarter profits fall suggests downside risk to the current consensus estimate – second chart.
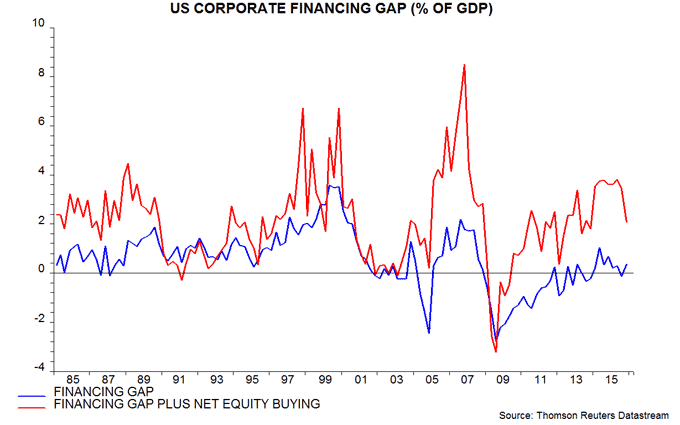
The Fed’s financial accounts show that the “financing gap” of non-financial corporations – the difference between their capital spending and retained earnings – rose to 0.4% of GDP in the fourth quarter, close to its long-term average (i.e. over 1985-2015) of 0.6%. This measure, however, understates the growth of leverage in recent years because it excludes borrowing to finance share buy-backs and cash takeovers. A broader corporate deficit measure adding in net equity purchases reached 3.8% of GDP in the second quarter of 2016 – significantly above a long-term average of 2.1%. It fell back, however, in the fourth quarter as net equity buying slowed sharply – third chart.
The financing gap measures have been inversely correlated with the future rate of change of business investment historically. The recent elevated level of the broader measure suggests that investment will grow moderately at best over coming quarters – fourth chart
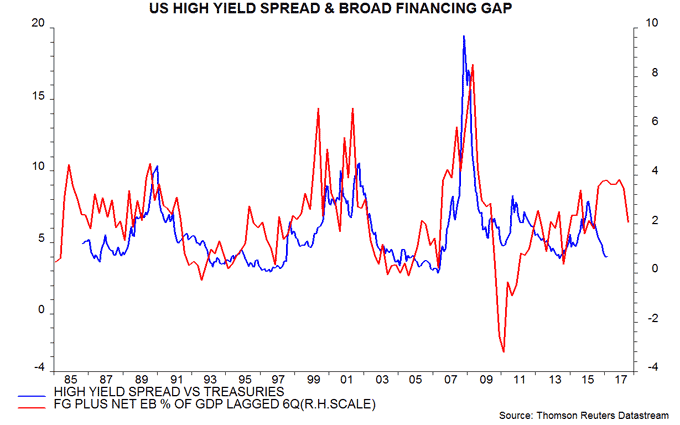
The broader measure also correlates, with a typical lag of six quarters, with the yield spread between low-rated corporate bonds and Treasuries. This relationship suggests that the current spread is significantly below “fair value” – fifth chart.
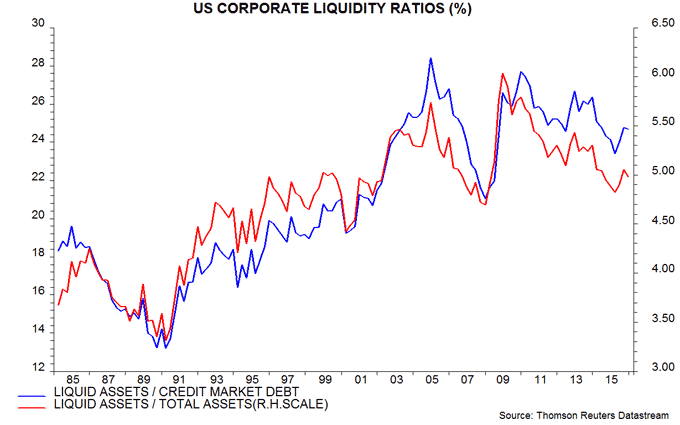
One favourable balance sheet development recently has been solid growth of broad money holdings – non-financial corporate M3 rose by 6.6% in the year to end-2016. Liquid assets, nevertheless, have fallen since 2009-10 relative to credit market debt and the overall balance sheet – sixth chart.

Reader Comments