A "monetarist" perspective on current equity markets
The global economy picked up strongly into end-2016, as had been predicted by faster monetary expansion earlier in the year. Growth should remain robust into spring 2017 but money trends are now cooling, indicating some loss of momentum in the summer. The liquidity backdrop for markets is becoming less favourable as the gap between real (i.e. inflation-adjusted) money growth and output expansion narrows. Relative monetary trends suggest that US equities will underperform.
On our calculations, GDP in the G7 major economies and seven large emerging economies (the “E7”) grew at a 3.2% annualised pace in the third quarter of 2016, up from just 1.7% in the fourth quarter of 2015 and the fastest since the third quarter of 2014. Business surveys signal a strong fourth quarter: J P Morgan’s global all-industry purchasing managers’ output index rose further between September and December.
Economic strength has surprised the consensus but is line with a “monetarist” prediction. Our key global forecasting indicator is the six-month growth rate of real (i.e. inflation-adjusted) narrow money in the G7 plus E7 economies. Narrow money comprises currency in circulation and demand deposits – forms of money most closely related to economic transactions. Turning points in this indicator have consistently led turning points in G7 plus E7 industrial output growth over the past 50+ years, typically by between six and 12 months.
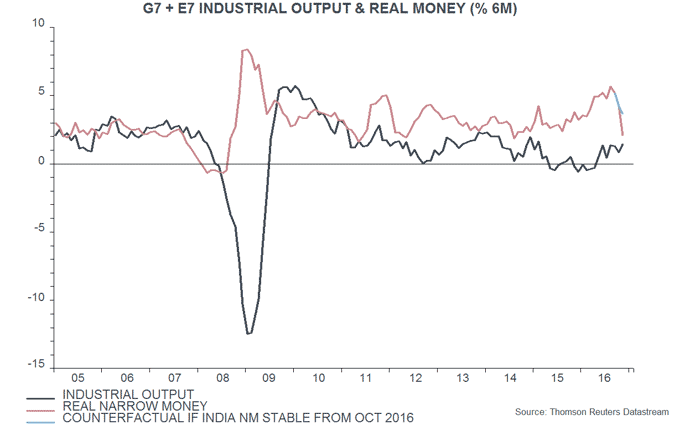
Real narrow money growth started to pick up in late 2015 and continued to rise into summer 2016, peaking in August at its fastest pace since 2009 – see first chart. Allowing for an average nine-month lead, this suggests that economic momentum will reach a peak in spring 2017.
Real money growth moderated in September / October before falling sharply in November. The latter move mainly reflects India’s bungled “demonetisation” programme: the authorities cancelled banknotes accounting for 86% of currency in circulation without ensuring a sufficient supply of replacement paper, contributing to a 23% plunge in narrow money M1 between end-October and end-November. This is negative for Indian near-term economic prospects but the global implications are probably limited. Nevertheless, our G7 plus E7 real money growth measure would have weakened further in November even without the India effect – first chart.
Our forecasting process seeks confirmation of monetary signals from a non-monetary composite leading indicator for the G7 plus E7 economies, derived from OECD country leading indicator data. This indicator combines a wide range of economic and financial series that have led activity fluctuations historically. Six-month growth of the indicator started to firm at end-2015 and continued to increase through October, the latest available month – second chart.
Our base-case scenario, therefore, is that the global economy will remain strong in early 2017 but will begin to lose momentum in the late spring / early summer. This scenario would be confirmed by a peaking out of leading indicator growth in late 2016 / early 2017. The fall in real money growth to date – excluding the India effect – suggests a moderate economic slowdown rather than significant weakness.
A counter-argument to the slowdown view is that US-led fiscal stimulus will act to boost global growth in the second half of 2017 and 2018. The effects of fiscal policy, however, should be incorporated in narrow money trends: shifts in money demand are largely driven by changes in spending intentions of households and firms, which would strengthen in response to an effective fiscal stimulus. If the counter-argument is correct, that is, real money growth should rebound in early 2017. Even if it does, the recent pull-back suggests a softer patch for the economy over the summer.
Fiscal expectations, moreover, may be overblown. The new US administration / Congress will make a significant tax reform package a priority but Congressional opposition to deficit expansion is likely to limit the net “giveaway”. Consensus may be harder to reach on plans to boost infrastructure spending. Outside the US, fiscal policies are unlikely to be significantly expansionary – Chinese fiscal stimulus, indeed, probably peaked in 2016.
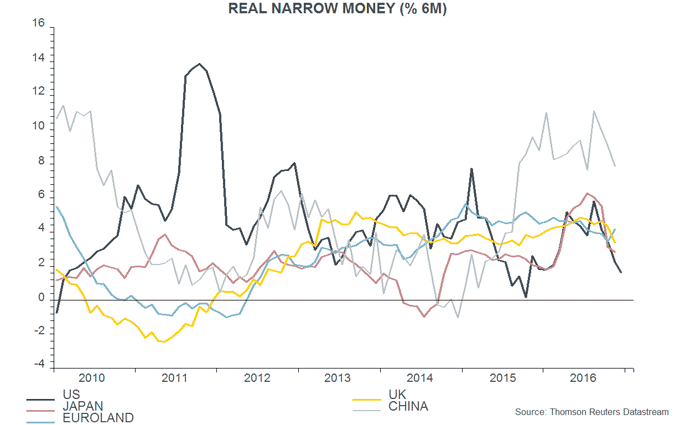
Partly reflecting fiscal hopes, the consensus expects the US to be the strongest major developed economy in 2017, contributing to further upward pressure on US rates and the US dollar. Monetary trends suggest otherwise. US six-month real narrow money growth fell sharply in late 2016, moving below rates of expansion in Japan, Euroland and the UK – third chart. A similar slowdown in late 2015 correctly signalled that economic growth would disappoint in the first half of 2016. 
Another questionable consensus forecast is that the renminbi will remain under downward pressure in 2017. A “monetarist” interpretation, however, is that currency weakness in 2016 was a symptom of super-loose monetary policy put in place after the 2014-15 economic slowdown. Strong money growth has succeeded in reviving the economy but is now feeding through to faster inflation, suggesting policy tightening in early 2017 and an associated slowdown in capital outflows.
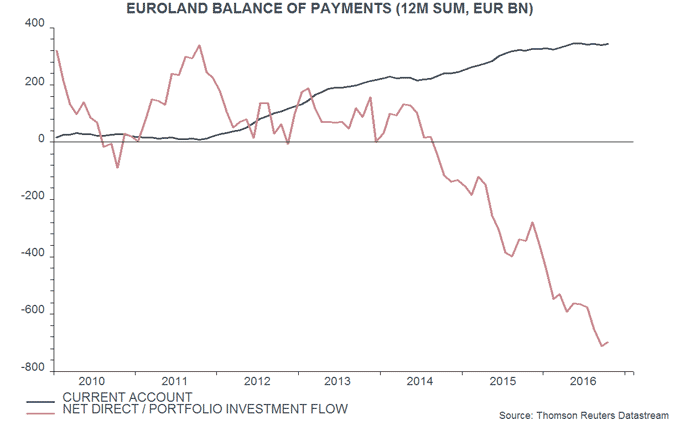
Eurozone equities underperformed in 2016 and remain out of favour, partly reflecting the perceived risk of “populists” increasing their influence or gaining control in 2017 elections in the Netherlands, France, Germany and – possibly – Italy. The net outflow of direct and portfolio investment capital from the region, however, reached a record 6.7% of GDP in the 12 months to September 2016, while real narrow money growth remains respectable and faster than in the US, Japan and the UK, suggesting solid economic prospects – third and fourth charts. Barring a worst-case political scenario, the capital exodus may slow or reverse in 2017, lifting the euro and asset prices.
Our previous quarterly commentary suggested that equity markets would withstand expected upward pressure on government bond yields, since real money growth remained far above output expansion, indicating a favourable liquidity backdrop. Real money is still outpacing output currently but the growth differential has narrowed, warranting greater caution. Our analysis of data since 1970 indicates that major equity market declines have usually been preceded by one or more of the following conditions: 1) G7 annual real narrow money growth falling below 3%; 2) real money growth falling below industrial output expansion; 3) real money growth falling by 3 percentage points or more within six months. We suggest monitoring these conditions to assess whether / when to shift to a defensive investment position.

Reader Comments