Global economy accelerating, money signal still positive
Global economic growth continues to strengthen, consistent with a forecast based on narrow money trends, which remain positive.
Global economic momentum is measured here by the two-quarter / six-month change in GDP or industrial output in the G7 major economies and seven large emerging economies (the “E7”*). The G7 plus E7 grouping dominates the global economy, accounting for two-thirds of GDP measured at “purchasing power parity” and nearly three-quarters in current US dollars**. Measuring changes over two quarters / six months is judged to optimise the trade-off between timely signals and noise.
Two-quarter growth in G7 plus E7 GDP is estimated to have risen from 1.1% in the first quarter to 1.2% in the second, or 2.4% at an annualised rate. Six-month industrial output growth, meanwhile, jumped to 1.1% in June, or 2.2% annualised, the fastest since February 2015 – see first chart.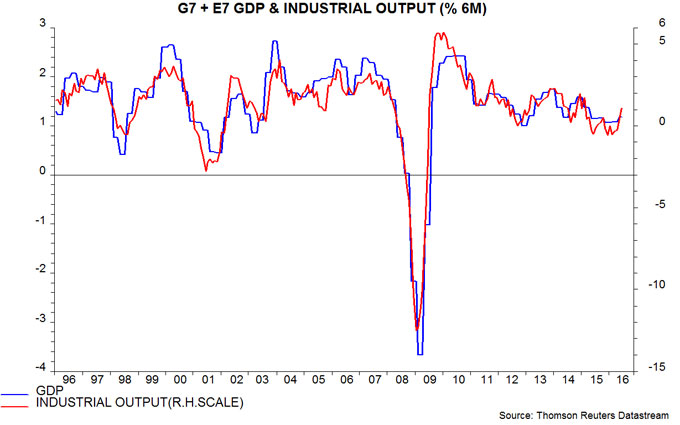
GDP and industrial output changes are closely correlated, with June six-month output growth consistent with annualised GDP expansion of about 2.75%. GDP momentum, therefore, was probably still firming as the second quarter ended.
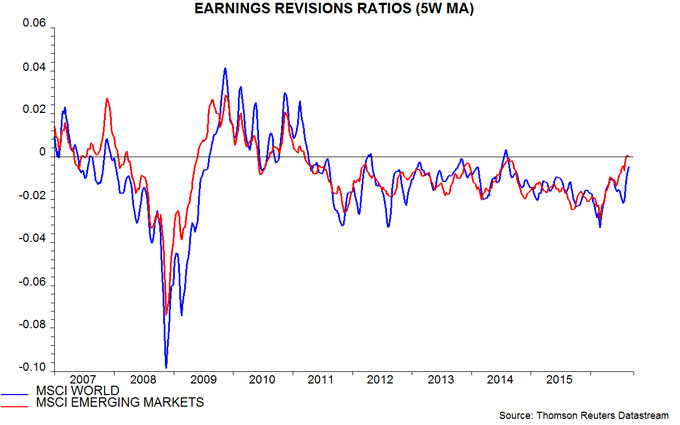
The US and China have released July industrial output data; six-month growth rose further in both cases. Additional positive signals are a further pick-up in six-month expansion of world steel output in July and a sharp increase in the equity analysts’ earnings revisions ratios for developed and emerging markets in July / August – second and third charts.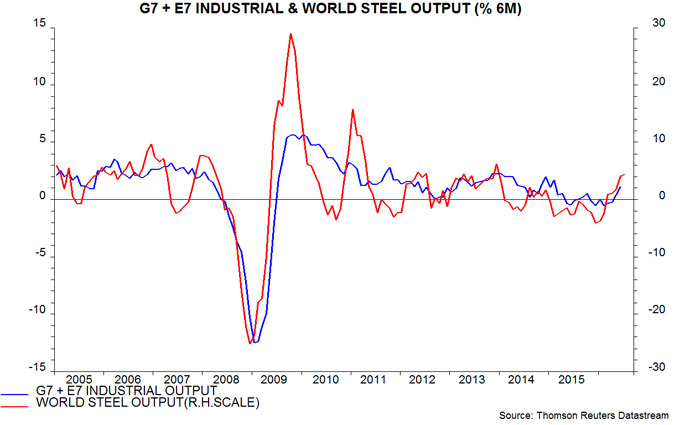
A summer revival in economic growth had been predicted by a rise in six-month G7 plus E7 real narrow money expansion from a low in August 2015 – real money turning points lead those in industrial output by nine months on average, according to a study of G7 data since the 1960s. Six-month growth of real narrow money continued to increase during the first half of 2016, reaching 5.2% in June, or 10.7% annualised, the fastest since 2009. It appears to have remained strong in July, judging from data for countries covering two-thirds of the G7 plus E7 aggregate – fourth chart. The suggestion is that the current cyclical upswing will extend through spring 2017, at least.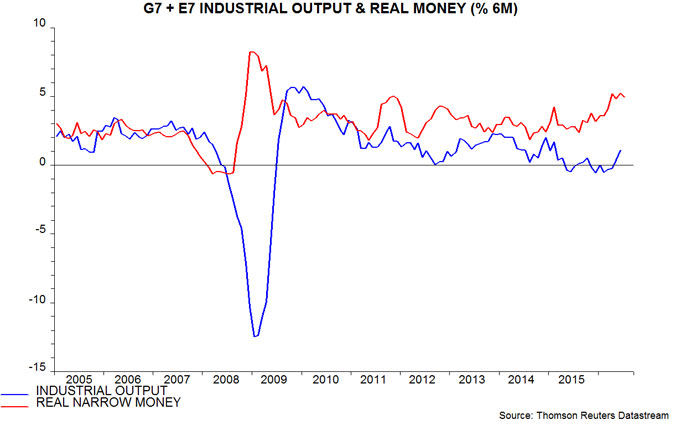
The forecasting approach here seeks confirmation for monetary signals from the OECD’s composite leading indicators, which combine a range of non-monetary forward-looking data. The OECD, bizarrely, suspended publication of its entire suite of indicators in response to the UK's Brexit vote – the most recent numbers are for April with data for May, June and July due to be released in early September. The OECD’s calculation method has been replicated to estimate its G7 “normalised” leading indicator, designed to signal whether future economic growth will be above-or below-trend. The indicator appears to have bottomed in April, edging higher in May and June, with early data suggesting a further increase in July – fifth chart. It is not possible to replicate the OECD’s E7 calculations (because the organisation does not release historical data on components) but the behaviour of the G7 indicator is consistent with an economic upswing.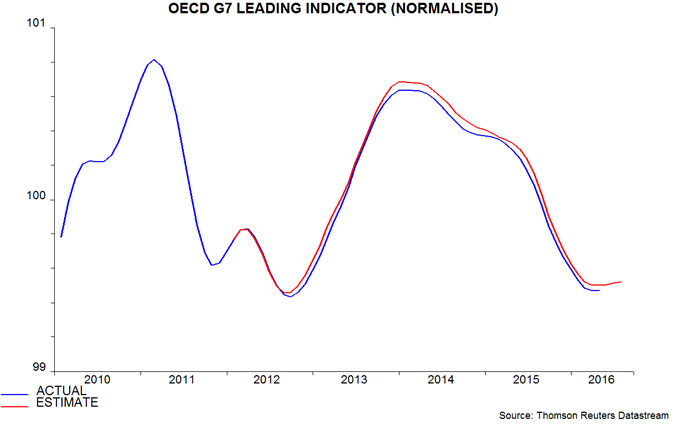
The forecast of significantly stronger global economic growth questions current consensus narratives about “secular stagnation”, low / negative “natural” levels of interest rates and the need for fiscal stimulus. A positive growth surprise could be the catalyst for a narrowing of the current wide gap between government bond yields and the level suggested by actual economic performance – sixth chart.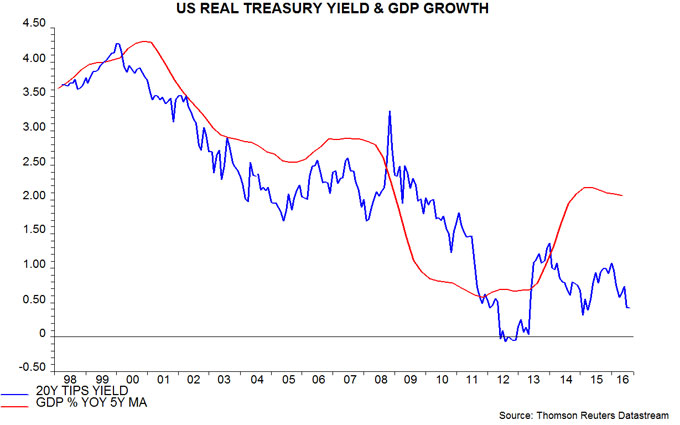
*Defined here as BRIC plus Mexico, Korea and Taiwan.
**Averages of PPP and current US dollar GDP weights are used to calculate the G7 plus E7 aggregates.

Reader Comments