Global leading indicators confirming positive monetary signal
The forecasting approach here uses non-monetary leading indicators to confirm signals from narrow money trends. Both are now giving a strongly positive message for global economic prospects.
The OECD yesterday released April data for its country composite leading indicators. A recovery in the US indicator was confirmed – see Tuesday’s post – while a number of other countries also registered a significant improvement.
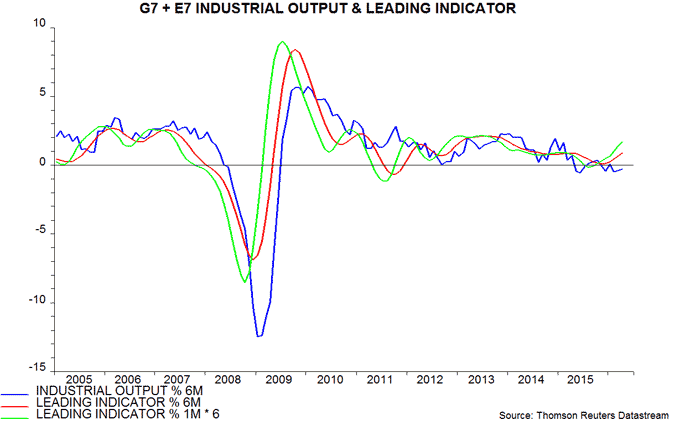
The first chart below shows a “global” leading indicator calculated by combining data for the G7 and emerging E7 countries. The six-month and one-month changes in the indicator strengthened further in April. A cyclical upswing in the indicator is clearly now under way.
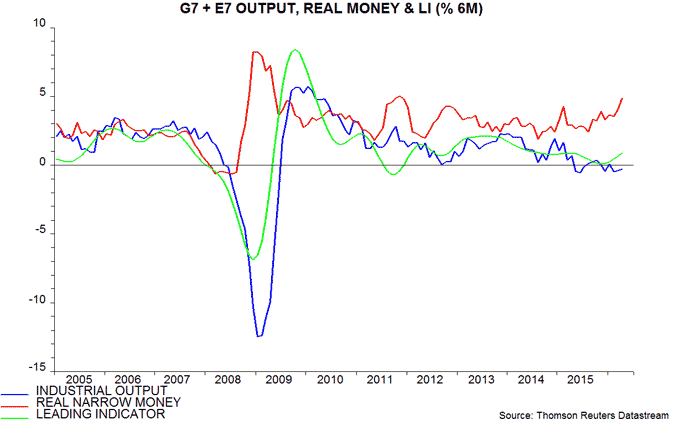
A study* of G7 data since the 1960s showed average lead times of real narrow money and the leading indicator with respect to industrial output of nine and six months respectively. The six-month change in global real narrow money bottomed in August 2015, with that of the leading indicator following in November – consistent with the historical three-month gap. The suggestion is that the six-month change in industrial output will recover from May, rising at least through October (based on the leading indicator) or January 2017 (based on monetary trends). 
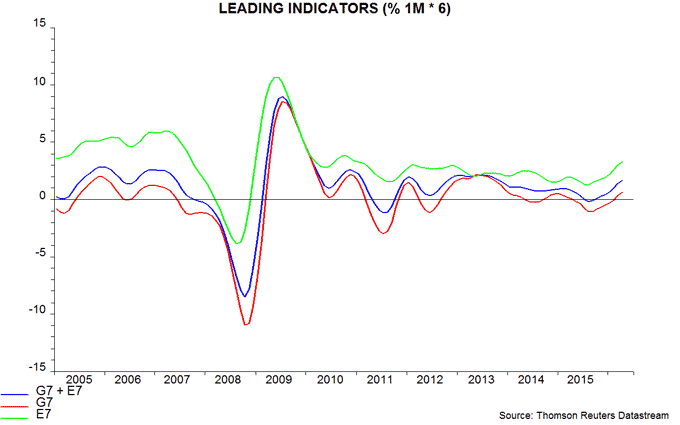
Both the G7 and E7 leading indicator components have turned up convincingly – third chart. The E7 pick-up is more impressive, reflecting recoveries in Russia and Brazil as well as China, and further strength in India.
Real narrow money and the leading indicator signal cyclical direction rather than the level of economic growth. The breadth of improvement in monetary and leading indicator trends across countries, however, suggests the potential for a significant positive growth surprise in late 2016.
*Available on request.

Reader Comments