US forecasting indicators less negative
The Atlanta Federal Reserve estimates that US GDP growth fell to 0.1% annualised in the first quarter, reflecting drags from (in order of magnitude) reduced inventory accumulation, a wider trade deficit and lower business investment. This would imply growth in the fourth and first quarters combined of only 0.7%, or 0.35% before annualisation.
The weakness of the economy in the last two quarters was predicted by a sharp fall in six-month growth of real (i.e. inflation-adjusted) narrow money between February and October 2015, i.e. points 8 and 9 in the first chart below. As the chart shows, turning points in six-month real money growth have consistently preceded those in two-quarter GDP expansion in recent years, usually by between six and 12 months.
Real narrow money growth has revived since October 2015, suggesting that that a recovery in GDP expansion will begin between April and October 2016. Labour market data, however, may soften near term in lagged response to GDP weakness. The employment indices of the Institute for Supply Management purchasing managers’ surveys are consistent with this scenario – second chart.
The forecast that GDP momentum is at or close to a low is supported by the OECD’s US composite leading indicator. The OECD presents its leading indicators in “ratio to trend” format, i.e. a rise (fall) indicates that the economy is growing above (below) trend. The US indicator continued to decline in February but at a slower pace, consistent with below-trend but rising GDP growth.
An alternative approach, preferred here, is to monitor the rate of change of the indicator before detrending. The one- and six-month changes are clearly signalling an approaching upturn in economic momentum – third chart
The indicator’s components are: housing starts, consumer sentiment, average weekly hours, durable orders, the ISM manufacturing purchasing managers’ index (PMI), the yield curve and stock prices. The PMI, stocks and weekly hours contributed to the recent recovery.
Neither monetary trends nor the leading indicator yet suggest a strong economic pick-up. There is a risk that real money growth will fall back as higher energy prices lift inflation.
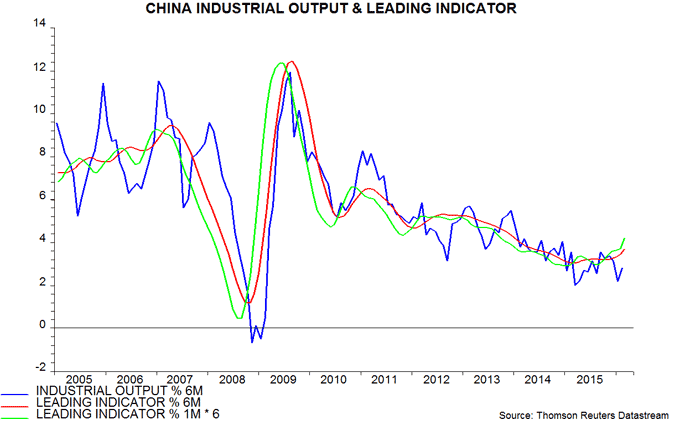
The recovery in the US indicator follows a pick-up in its Chinese counterpart – fourth chart. The twin improvement is consistent with the central scenario here of a recovery in global economic growth during 2016 – see Friday's post.


Reader Comments