Market woes due to US / credit tightening not China
Current market weakness, on the judgement here, reflects two main factors: US economic growth has fallen to stall speed, as predicted by a sharp slowdown in real narrow money during 2015; and a further plunge in the oil price has raised energy-related default risk and led to a generalised tightening of credit conditions.
Markets are fearful that tighter credit will tip the US and global economies over into a recession.
The consensus view that market weakness is being driven by events in China and other emerging economies is not shared here. Chinese economic woes are well discounted and recent news is consistent with improving conditions – see below.
Monday’s post argued that a US recession is still not the most likely scenario, based on current evidence. Real narrow money, in particular, did not contract during 2015 and recovered some momentum at year-end. US recession risk, however, is greater now than during scares in 2011 and 2012.
Important upcoming indicators for assessing the likely extent of US economic weakness include:
-
January ISM manufacturing new orders (1 February). A fall in the orders index below 42.5 (49.2 in December) would support a recession scenario. The Philadelphia Fed manufacturing survey (tomorrow) often provides an early guide to the ISM: a drop in the current new orders balance below -15 would be consistent with a sub-42.5 ISM reading.
-
January Conference Board consumer expectations (26 January). Expectations usually fall sharply at the onset of recessions. The Michigan survey expectations component, however, rose in early January.
-
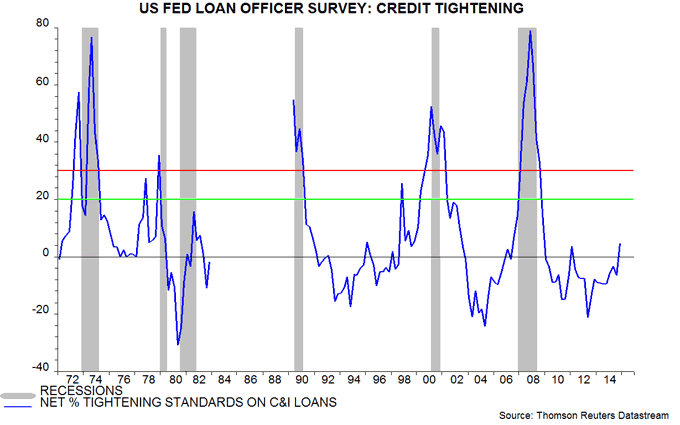
Credit tightening balances for commercial and industrial loans in the Fed’s January senior loan officer survey (early February). A rise in the average of the balances for large / medium and small firms above 20 would be worrying, while a move above 30 would strongly suggest an oncoming recession – see first chart.

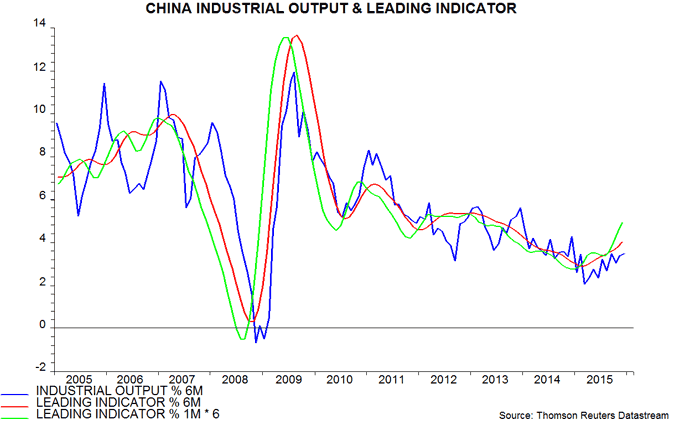
Chinese economic news yesterday slightly disappointed consensus expectations but is nonetheless consistent with an ongoing gradual recovery in momentum. The preferred growth indicator here is the six-month change in industrial output, which matched its September high in December and is well above its March low. The recent firming is in line with the message from the OECD’s leading indicator – second chart*.
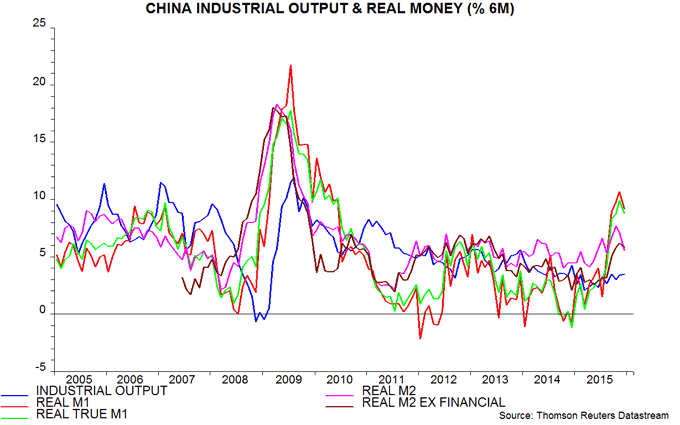
Money / credit trends continue to suggest a more significant recovery in the first half of 2016. The best narrow and broad money measures for forecasting purposes are “true” M1 and M2 excluding financial deposits: true M1, unlike the official M1 aggregate, includes household demand deposits, while financial deposits grew unusually rapidly in 2014-15, causing M2 to overstate economic prospects. Six-month growth of both preferred measures, deflated by consumer prices, has risen sharply since mid-2015, suggesting a stronger economy by the end of the first quarter, based on a typical nine-month lead – third chart.
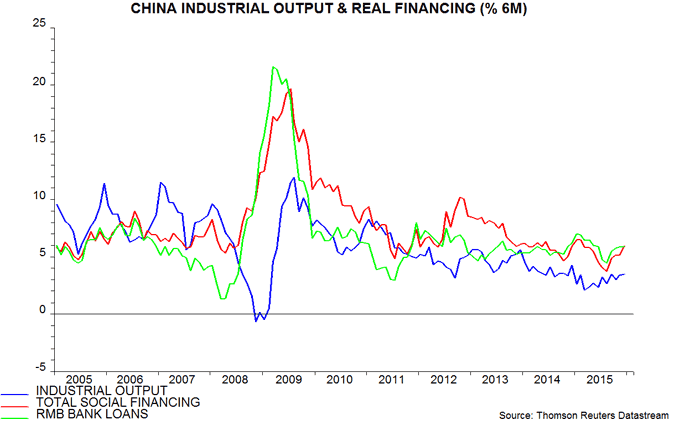
Credit trends are similarly hopeful, with six-month growth of real total social financing (TSF) and RMB bank loans rebounding since mid-2015 – fourth chart. One caveat is that the TSF numbers do not take account of repayments of overseas debt by Chinese corporations. These, however, are unlikely to have been large enough to offset the pick-up in onshore credit: according to official data on gross external debt, Chinese entities, excluding general government and banks, reduced their liabilities by $35 billion during the third quarter, equivalent to 0.2% of the stock of TSF.
*Based on the World Bank’s seasonally-adjusted industrial output series, updated for November / December by applying official year-on-year growth data to year-earlier levels.

Reader Comments