UK household wealth / income ratio approaching new record
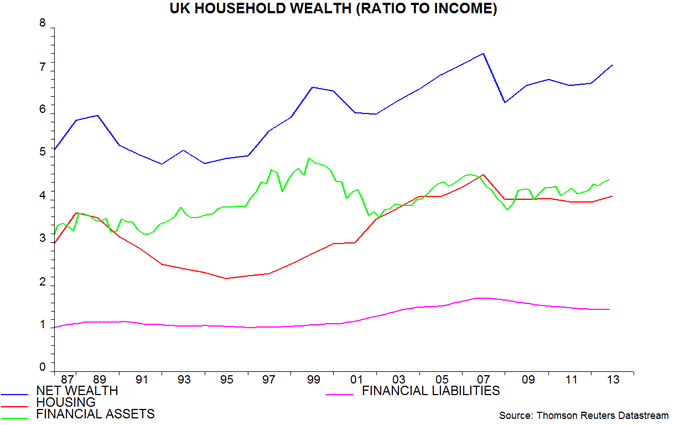
UK households’ net housing and financial wealth (i.e. the value of housing and financial assets minus financial liabilities) rose by an estimated* 8.3% during 2013, pushing its ratio to annual disposable income up to 7.14 – close to a record high of 7.4 reached at end-2007.
The first chart shows the net wealth to income ratio broken down into housing, financial assets and financial liabilities. The recovery in the ratio since 2008 has been driven by rising financial wealth and a reduction in liabilities. The housing wealth to income ratio has been broadly stable over this period, though increased in 2013 as house prices picked up.
The rise in net financial wealth mainly reflects gains in equity and bond markets but, in addition, households ran a large financial surplus over 2009-12, cumulating to 8.9% of annual income over the four years (i.e. income exceeded consumption and capital spending over this period, allowing households to accumulate financial assets and / or reduce debt).
The net wealth to income ratio is likely to reach a new record by end-2014, assuming house price inflation of about 10% during the course of the year and stable financial markets.
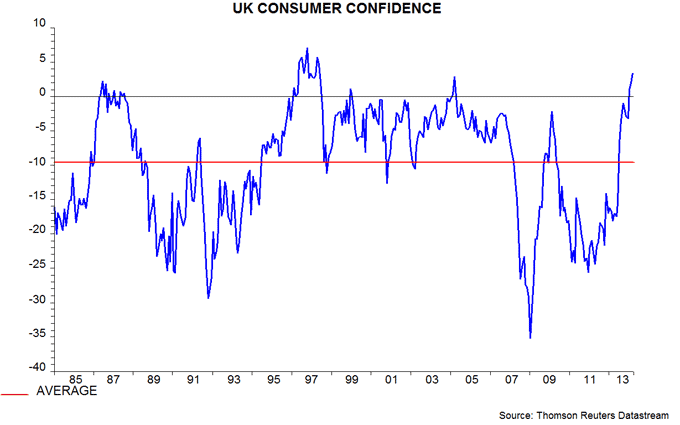
Rising wealth helps to explain why consumer confidence is at the top of its historical range despite the “cost of living crisis” – second chart. It also tempers concern about a recent fall in the saving ratio, which, in any case, remains respectable – 5.0% in the fourth quarter of 2013, close to a 20-year average of 5.5%.
*Based on actual data on financial assets / liabilities and income, and an assumption that the value of the housing stock rose by 5.5% during 2013, equal to the increase in the ONS house price index between December 2012 and December 2013.


Reader Comments