Global leading indicators confirm coming growth peak
The approach to forecasting the global cycle employed here relies partly on short and longer-term leading indicators calculated by transforming and combining the OECD’s country leading indices. The message from these derived indicators often disagrees with the OECD’s interpretation of its own data.
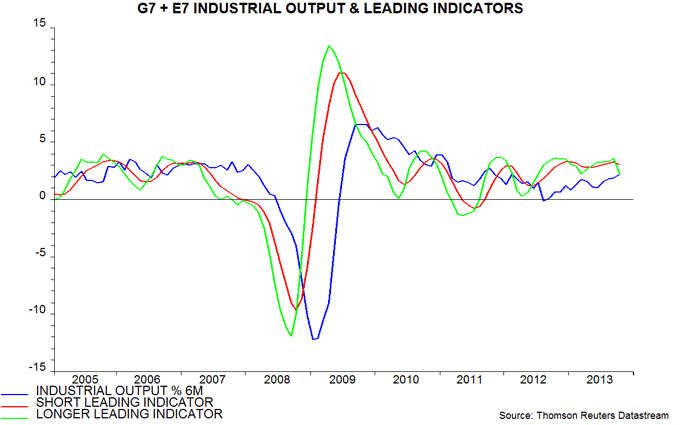
For example, today’s OECD press release accompanying the release of October figures states that its indicators “point to an improving economic outlook in most major economies”. The derived short and longer-term indicators, however, fell from September highs, suggesting that current strong global growth is approaching a peak – see first chart.
The short and longer-term indicators have led turning points in six-month industrial output momentum by averages of three and five months respectively in recent cycles. The September peak in the two indicators, therefore, is consistent with global industrial output expansion topping out between December and February.
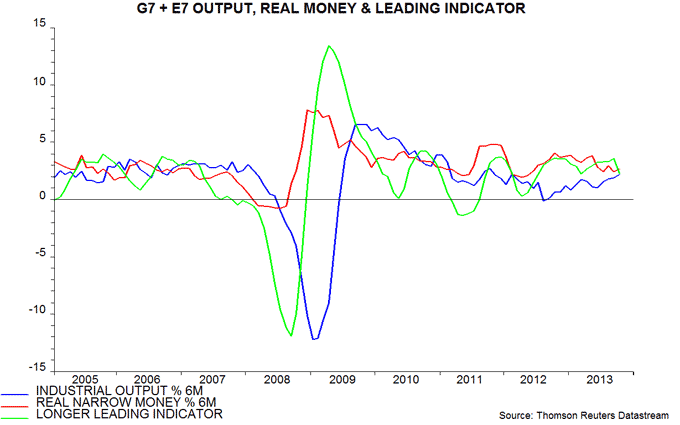
The signal from the indicators is consistent with monetary trends: global six-month real narrow money expansion peaked in May and typically leads output growth by six months or so – second chart. The latest monetary data, for October, remain respectable, suggesting that economic momentum will moderate rather than slow sharply in early 2014.


Reader Comments