UK vacancy rate suggests limited labour market slack
The November Inflation Report reaffirmed the MPC’s view that there is significant “effective” slack in the UK labour market. This view rests partly on an estimate that the “medium-term equilibrium unemployment rate” – a measure relevant for assessing wage pressures over the MPC’s three-year forecast horizon – is currently 6.5% versus an actual rate of 7.6% in the third quarter of 2013. This suggests that the MPC will allow unemployment to fall beneath the 7.0% forward guidance threshold before raising interest rates, and may even lower the threshold as the actual rate approaches this level.
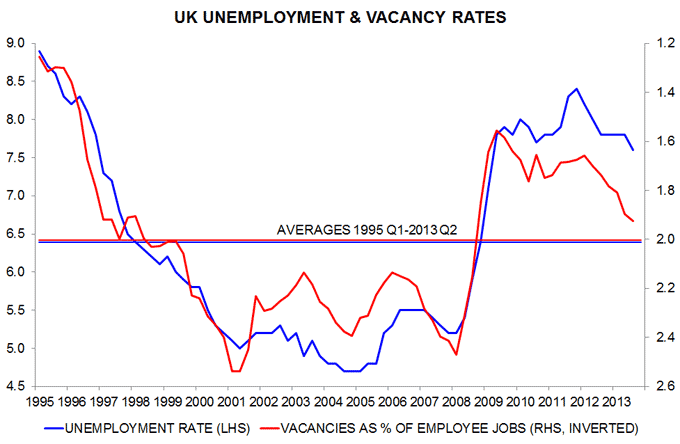
An alternative employer-based measure of labour market slack is the vacancy rate – the stock of unfilled positions expressed as a percentage of the number of filled employee jobs. If effective labour supply were much higher than demand, as the MPC believes, employers would find it easy to fill job openings and the vacancy rate would be low and stable. It has, in fact, risen significantly over the last 18 months – from 1.65% in the first quarter of 2012 to 1.9% in the third quarter of 2013. The latter matches the fourth quarter of 2008, suggesting that labour market slack is similar now to then. This is at odds with the message from the unemployment rate, which is 1.2 percentage points above its level of 6.4% in the fourth quarter of 2008.
The first chart compares the unemployment and vacancy rates since 1995, with the latter plotted inverted*. The scales have been adjusted to align the 1995-2013 averages of the two series. The current vacancy rate of 1.9% is only 0.1 percentage points below its 2.0% average, suggesting that – from the perspective of employers – labour market conditions are close to normal. The unemployment rate of 7.6%, however, remains far above its 6.4% average – close to the MPC’s current estimate of the “medium-term equilibrium rate”.
The message from the vacancy rate accords with business survey evidence. In the third quarter British Chambers of Commerce survey, the seasonally-adjusted percentage of manufacturers reporting recruitment difficulties was above its post-1995 average, while the services percentage was below average by the smallest margin since the fourth quarter of 2008.
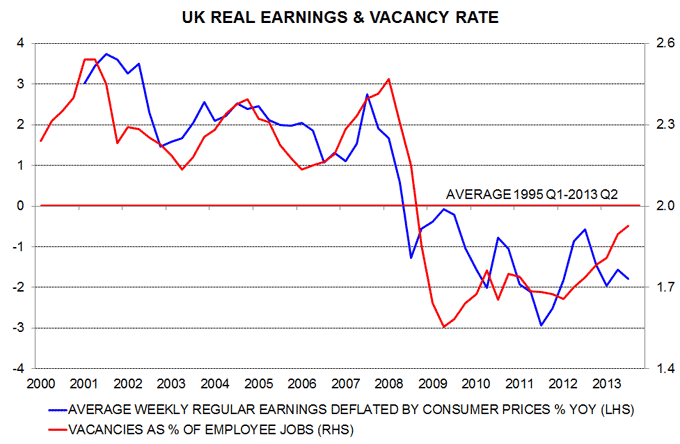
The second chart shows the vacancy rate – no longer inverted – and annual growth of inflation-adjusted regular earnings (i.e. excluding bonuses). Real earnings started to contract as the vacancy rate moved below average in late 2008. On current trends, the rate will rise above 2.0% during the first half of 2014, suggesting that nominal earnings growth will recover and move above inflation later next year.
A resumption of real earnings expansion would, of course, provide welcome relief for hard-pressed consumers but would need to be matched by improved productivity performance to prevent upward pressure on unit labour costs / prices, or else a further squeeze on profits. The view here is that, in addition to being too sanguine about labour market slack, the MPC is overoptimistic about productivity prospects – available evidence suggests continued weakness in the third quarter despite strong economic growth, as noted in a post last week.
*The vacancy rate was estimated before the second quarter of 2001 by linking the current employer survey based vacancies series with an earlier series, ending in the first quarter of 2001, covering vacancies at job centres. This linking assumes that 1) the vacancy rate was unchanged between the first and second quarters of 2001 (reasonable – unemployment was little changed between the two quarters) and 2) job centre vacancies were a constant proportion of total vacancies from 1995 to 2001.


Reader Comments