UK money update: still weak
UK money trends remain relatively weak, arguing that the MPC bears significant responsibility for economic underperformance.
Narrow and broad money – as measured by non-financial M1 / M4 – rose by 0.4% and 0.3% respectively in December, below gains of 0.9% and 0.6% for equivalent Eurozone measures,
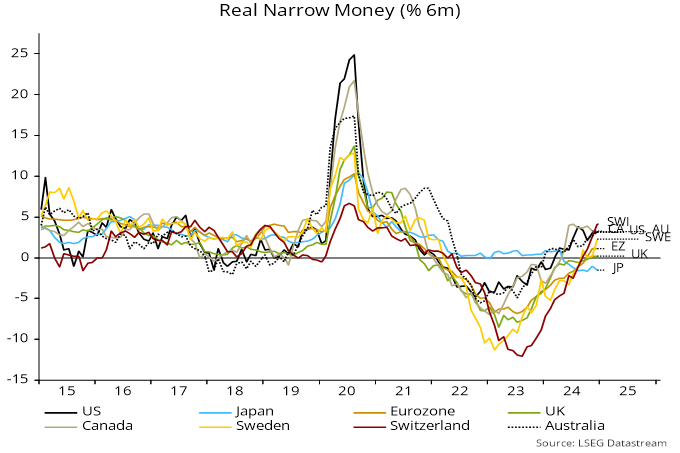
UK six-month real narrow money momentum was static and barely positive in December, in contrast to higher and rising momentum in the Eurozone, Sweden and Switzerland, where policy rates fell by 100-150 bp during 2024 versus the UK’s 50 bp – see chart 1.
Chart 1
Six-month growth of (nominal) broad money is similar in the UK and Eurozone (4.1% and 4.0% annualised respectively) but the UK sectoral breakdown is unfavourable – the increase was entirely attributable to households, with corporate money holdings stagnant.
The narrow money decomposition is worse. Six-month momentum of corporate real narrow money remains negative and has weakened since July. Eurozone momentum, by contrast, turned positive in October, rising further into year-end – charts 2 and 3.
Chart 2
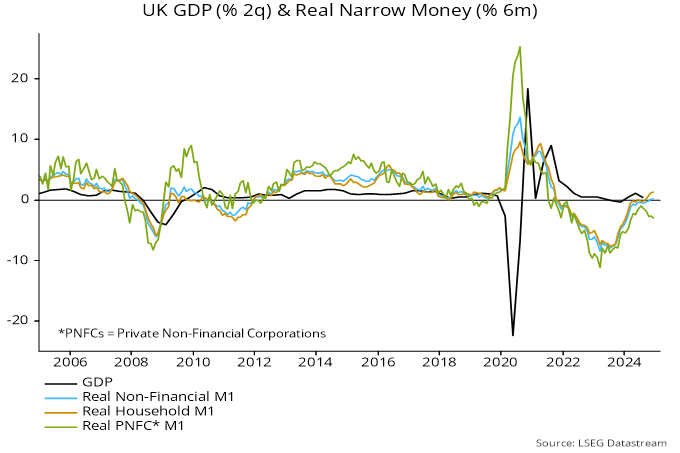
Chart 3

Corporate money weakness suggests that companies were under financial pressure to retrench before the Budget national insurance raid.
The contention here is that household money holdings were boosted by asset sales in anticipation of possible tax changes in the Budget – see previous post. This effect may still be inflating six-month household and aggregate broad money growth.
Households, in any case, are unlikely to be in the mood to spend “excess” money holdings against a backdrop of corporate gloom and rising job losses – unless the MPC accelerates rate cuts.
The MPC’s inappropriately restrictive stance encompasses its QT operations as well as rate policy. The Bank of England’s gilt holdings fell by the equivalent of 3.2% of the broad money stock in the 12 months to December versus comparable reductions of 1.8% and 2.0% respectively in the US and Eurozone (i.e. in Fed holdings of Treasuries and Eurosystem holdings of Eurozone government securities).
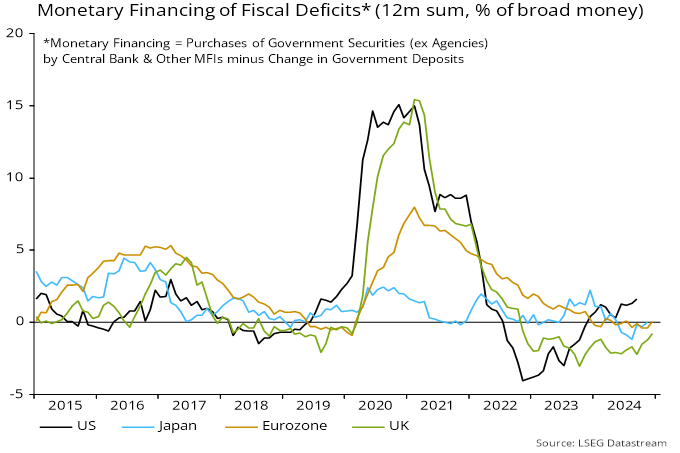
Monetary financing of the fiscal deficit (i.e. taking into account commercial banking system transactions in securities and changes in fiscal deposits as well as QE / QT) subtracted from broad money growth in the UK in the latest 12 months versus a neutral impact in the Eurozone / Japan and a significant positive contribution in the US – chart 4.
Chart 4