Global money update: further slowdown
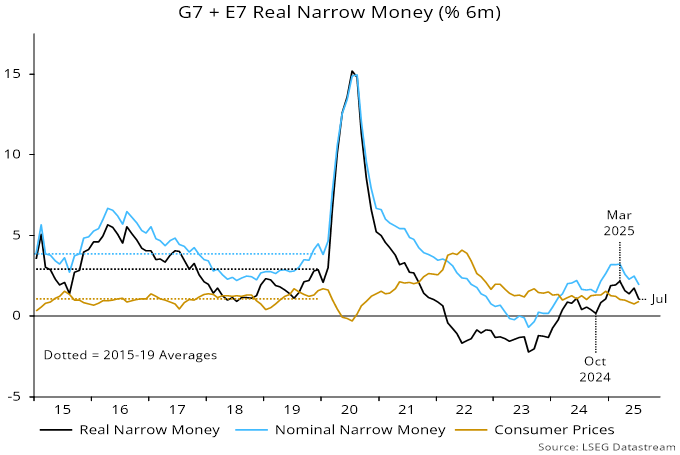
Global six-month real narrow money momentum – a key leading indicator in the forecasting approach used here – is estimated to have fallen to its lowest since November / December in July, based on monetary data for countries with a combined 88% weight.
The resumption of a decline from a March peak reflected both a slowdown in nominal money growth and a small rise in six-month CPI momentum (which, however, remains slightly below its 2015-19 average) – see chart 1.
Chart 1
A rise in real money growth between October 2024 and March suggested that the global economy would regain momentum in H2 2025 after a weak start to the year. Tariff effects cloud interpretation but PMI results are consistent with this forecast, with August DM flash numbers reading across to a rise in global manufacturing PMI new orders to a six-month high – chart 2.
Chart 2
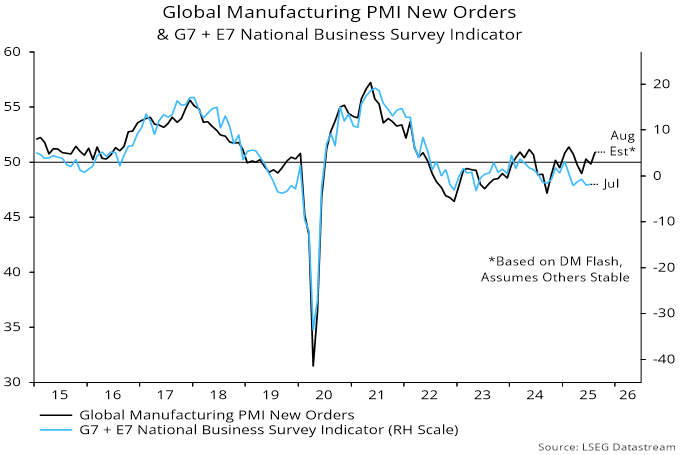
An alternative indicator calculated here using national survey data has been lagging the PMI but may also have increased in August. US regional Fed manufacturing surveys are pointing to stronger ISM results.
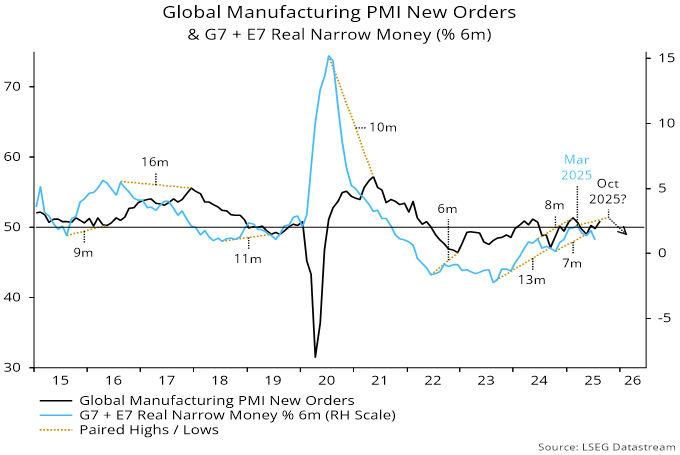
Still, the slowdown in real money momentum since March suggests that survey strength, if confirmed, will prove short-lived, with another inflection weaker before year-end – chart 3.
Chart 3
The July decline in global real money momentum mainly reflected a US fall to its lowest since March last year – chart 4. US money growth may have been supported in H1 by a run-down of the Treasury’s cash balance at the Fed. With the debt ceiling now raised, the balance stabilised in July and has increased in August, with financing plans targeting a further rise, i.e. Treasury cash-raising may drain money from private accounts.
Chart 4
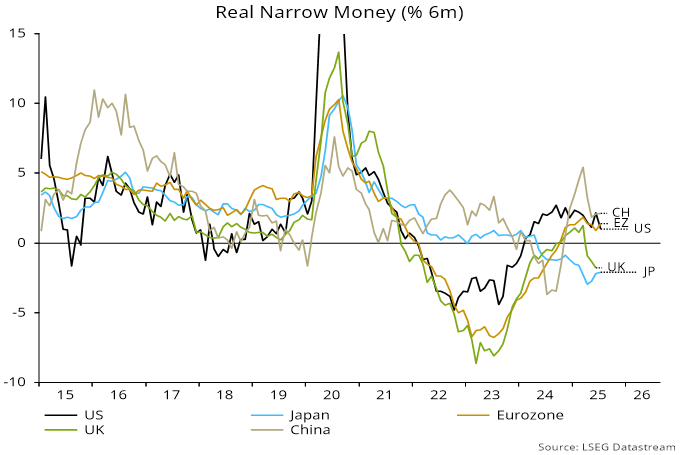
Real money momentum rose slightly in China and the Eurozone but remains below recent peaks, with Japan little changed in negative territory and UK July numbers yet to be released.