Chinese stocks climb “wall of worry”
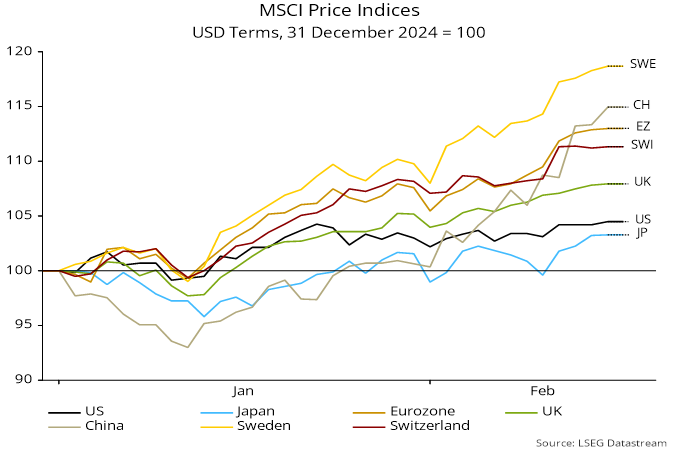
MSCI indices for continental Europe and China have outperformed year-to-date – see chart 1.
Chart 1
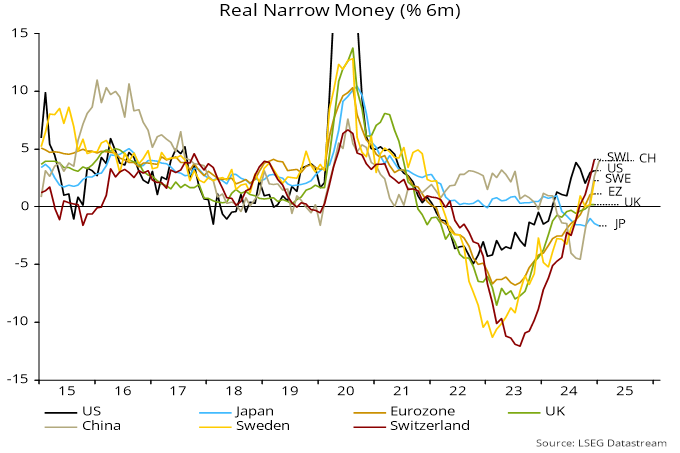
The pattern of returns echoes monetary trends: six-month real narrow money growth has picked up in China and continental Europe while moving sideways in the US, with Japan and the UK lagging – chart 2.
Chart 2
A previous post noted that Chinese money / credit numbers strengthened significantly in December. The pick-up was sustained in January: six-month growth rates of the narrow / broad monetary aggregates followed here rose further and are back around the middle of recent historical ranges – chart 3.
Chart 3
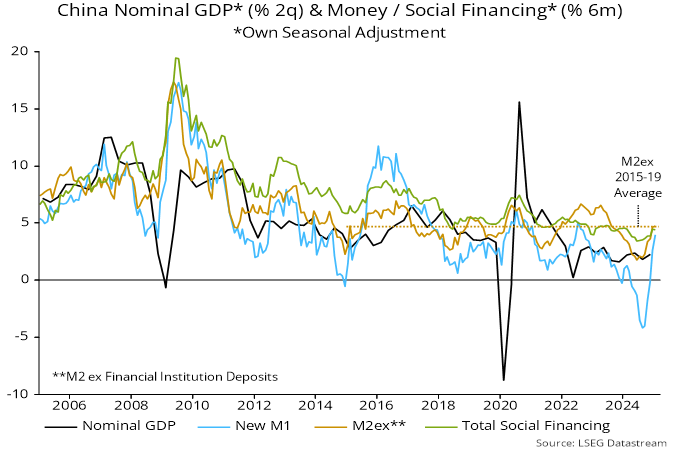
The official M1 definition has been revised to include personal demand deposits, aligning it with international practice. The new measure is close to the “true M1” aggregate used here historically.
Annual growth of official M2 eased from 7.3% in December to 7.0% in January. The slowdown, however, reflected a fall in bank deposits held by non-bank financial institutions – movements in such deposits are less informative about economic prospects. Annual and six-month growth of non-financial M2 rose further in January.
The sharp turnaround in six-month narrow money momentum has been mirrored by a “credit impulse” measure based on the six-month flow of total social financing – chart 4.
Chart 4
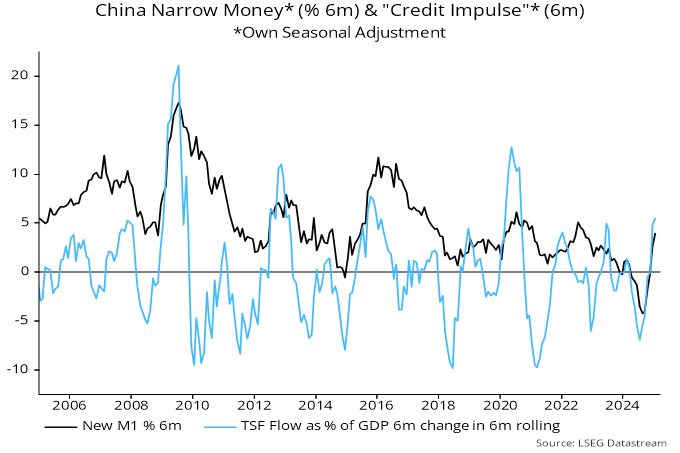
The turnaround in money / credit momentum partly reflects the negative impact of regulatory changes last spring dropping out of six-month calculations. Seasonal adjustment is more uncertain in January / February because of New Year timing effects. Money / credit growth is not yet strong by historical standards.
Still, money trends warrant increased confidence that domestic demand growth will recover sufficiently to offset any loss of support from net exports due to trade conflict.
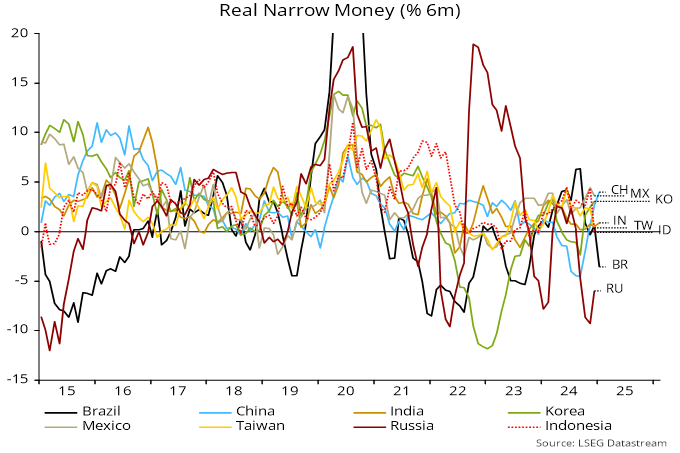
MSCI China remains on a steep valuation discount to the rest of EM despite recent outperformance – chart 5. Chinese six-month real narrow money momentum is now stronger than in most other EMs – chart 6.
Chart 5
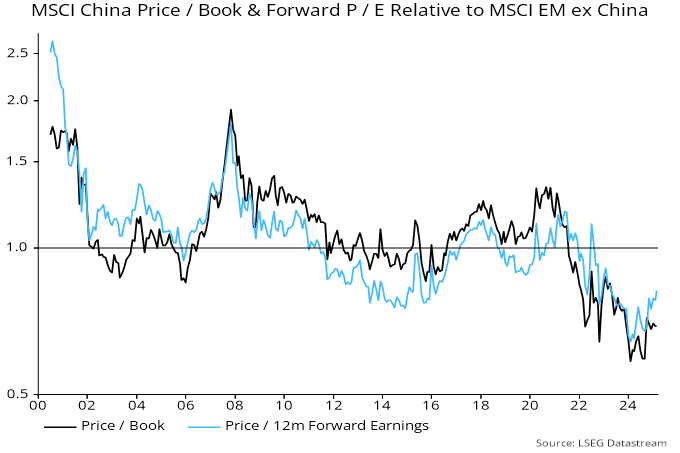
Chart 6
China’s GDP certainly looks quite odd compared to money growth. It’s been remarkably stable for the last two years.