

A “monetarist” perspective on current equity markets
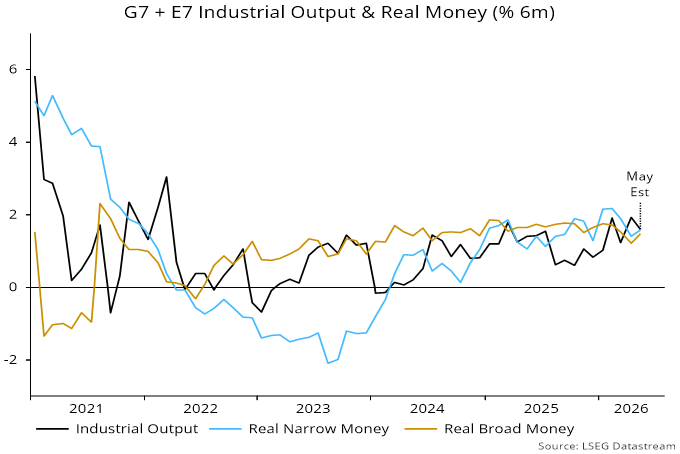
Global six-month real money growth has fallen back since early 2026, crossing below industrial output expansion in April – see chart 1. This suggests that the global economy will lose some momentum during H2, while the monetary backdrop for markets has become less favourable, at least temporarily.
Chart 1
From a cyclical perspective, housing indicators remain weak, while the stockbuilding cycle appears to be reaching a peak, with a downswing likely to extend well into 2027.
The optimistic case is that real money growth will be supported by a reversal of the H1 boost to inflation from higher energy prices, assuming that the reopening of the Persian Gulf proves lasting, while the business investment cycle remains in an upswing driven by seemingly insatiable demand for AI compute. Still, upward pressure on financing costs from the vast spending could start to constrain momentum soon, while the disinflation lift to real money growth could be offset by slower nominal expansion, reflecting H1 interest rate rises.
A conservative view of equity market prospects, therefore, appears warranted, as least until monetary indicators give an “all-clear” signal. The cyclical framework employed here suggests that equities will perform poorly over the medium term: weak phases in the three investment cycles are scheduled to coincide at some point in 2027-28, a condition historically associated with major bear markets.
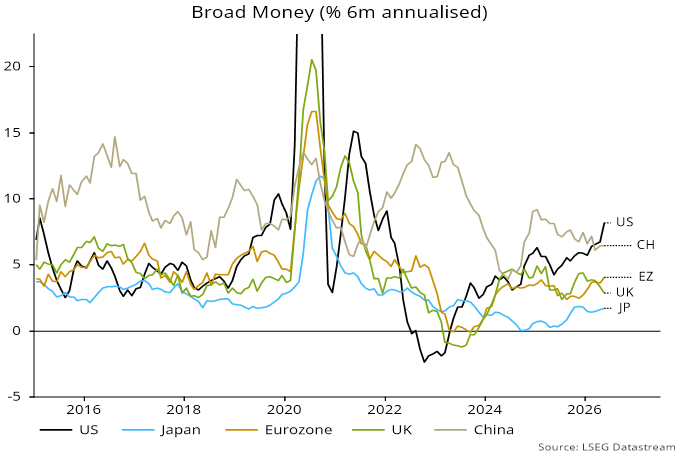
An important recent change has been a divergence of money growth across major economies, with US expansion picking up to a level inconsistent with 2% inflation, in contrast to weakness in Europe and Japan – see charts 2 and 3. This suggests superior US near-term economic prospects and a need for opposite monetary policy adjustments. If forthcoming, these could sustain a recent recovery in the US dollar, likely acting as another headwind for markets.
Chart 2
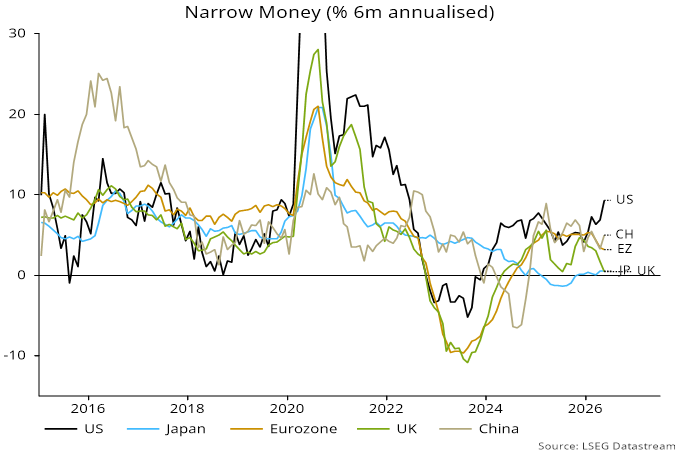
Chart 3
US monetary acceleration gathered pace after the Fed’s December decision to resume balance sheet expansion, a policy that Chair Warsh wants to reverse. Action is unlikely before late 2026 but – if combined with a near-term interest rate rise – could cause money growth to slow sharply in H1 2027.
Despite US strength, global annual broad money growth is below its pre-pandemic (i.e. 2015-19) average, reflecting softness in China as well as Europe / Japan. This suggests that inflationary pressures globally will remain contained, even if US medium-term risks are rising.
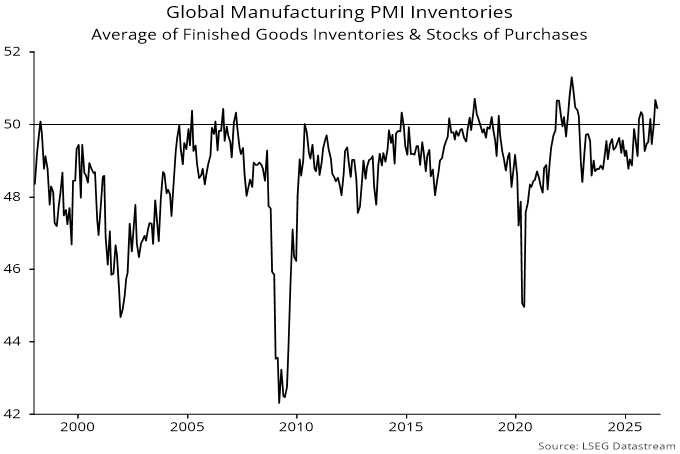
The judgement that the stockbuilding cycle is peaking is supported by the global manufacturing purchasing managers’ survey, with an average of the finished goods inventories and stocks of purchases indices reaching its fifth highest level on record in May – chart 4. Downswings in the cycle were historically associated with underperformance of cyclical sectors – notably materials, financials and communication services – versus defensive sectors, especially health care and consumer staples.
Chart 4
Cycle fluctuations were also reflected in prices of production inputs including electronic components as well as industrial commodities. A coming downswing could challenge optimistic forecasts for medium-term earnings growth of chipmakers and other hardware suppliers.