Chinese economy slowing, signals mixed
Chinese monetary trends remain worrying but non-monetary leading indicators are giving a more hopeful message for economic prospects. A further slowdown is expected over the remainder of 2018 but weakness may be contained.
The forecasting approach followed here uses non-monetary leading indicators – usefully summarised by the OECD’s composite measures – to cross-check the message from monetary trends. In China’s case, the signals currently conflict, reducing confidence in the forecast.
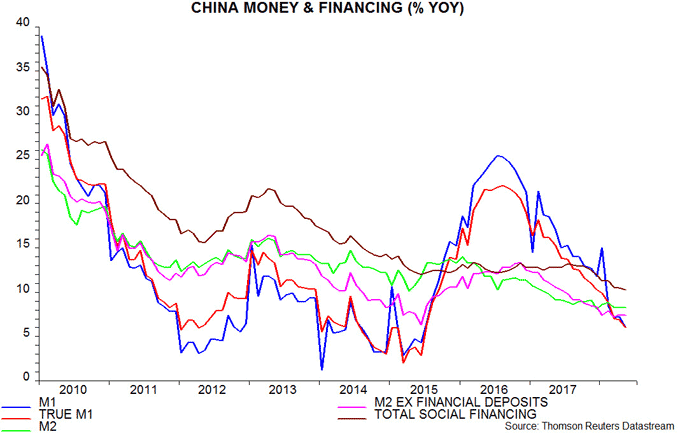
Monetary trends are unambiguously weak. Annual growth of the official M1 measure fell further to 6.0% in May, the least since 2015, while M2 growth was stable at 8.3%, just above December’s record-low 8.1%. The alternative money measures preferred here were similarly soft, as was the “total social financing” credit measure – see first chart.

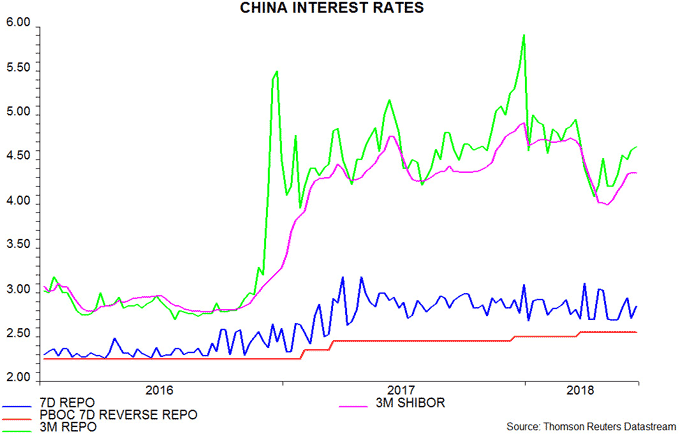
Previous posts suggested that monetary trends would revive in response to an apparent policy reversal towards easing in April, reflected in a sharp fall in term money market rates, although the timing and extent of a recovery were uncertain. The May money and credit data indicate that the policy shift has yet to gain traction, while money rates have recently partially retraced their decline – second chart.

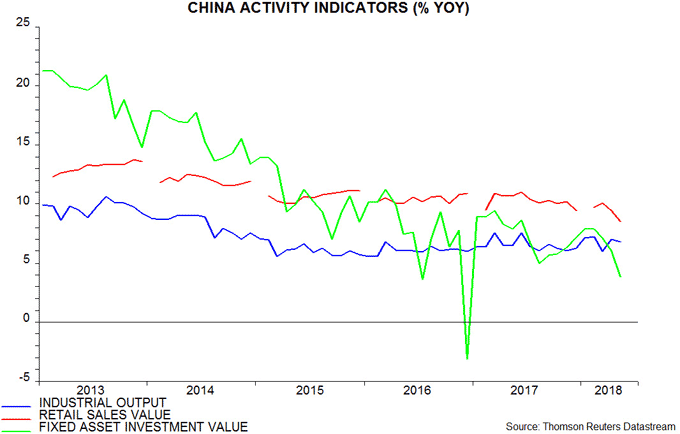
Activity news for May released today appears, on the surface, to be consistent with the negative message from money trends. Annual growth rates of industrial output, retail sales and fixed asset investment fell from April and undershot consensus estimates. Investment growth weakened particularly sharply – third chart.

Some details of the reports, however, jar with a negative interpretation. Annual growth of housing sales and starts rose smartly – fourth chart. Steel production was also notably strong. The sharp fall in investment growth, meanwhile, reflected weakness in infrastructure spending, with private capex expansion only slightly lower.

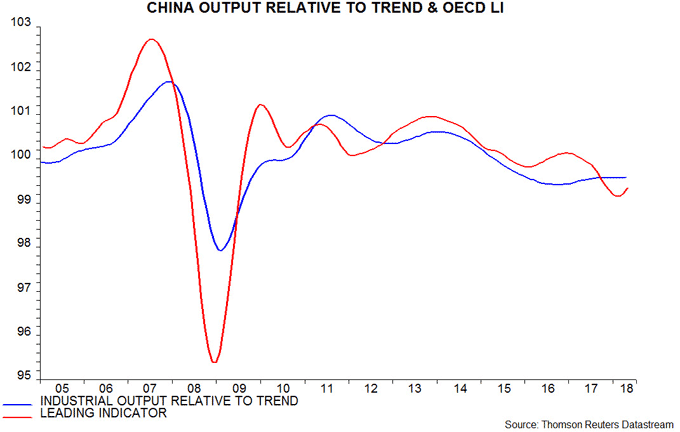
The OECD’s Chinese composite leading indicator, meanwhile, rose for a second month in April, according to data released yesterday – fifth chart. The six components of the indicator are: steel production, motor vehicle production, building completions, production of chemical fertilisers, the export orders balance from the PBoC’s quarterly 5000 enterprise survey and stock market turnover. New data for the first three components released today imply a positive contribution to the indicator reading for May, according to our calculations.

The decline in the leading indicator into February suggests an economic slowdown through late 2018, consistent with the message from monetary trends. Prospects further out are cloudy but a pessimistic bias will be retained here pending a revival in money trends.

Reader Comments