US money trends still strengthening
US monetary news remains upbeat, suggesting that stronger economic growth in late 2017 / early 2018 will force the Fed to tighten by more than currently discounted.
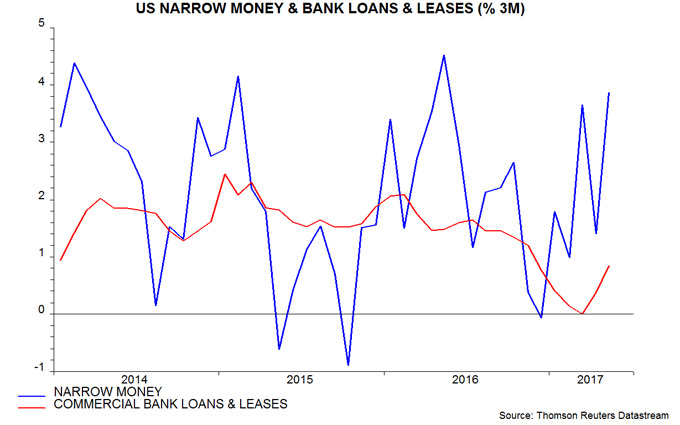
The narrow money measure tracked here fell in the week to 29 May but is on course to rise by about 1.75% in May from April (month average basis). This would push three-month growth up to about 4% (not annualised), the fastest since May 2016 and up from zero in December – see first chart.
Bank lending, meanwhile, is reviving. The stock of commercial bank loans and leases rose by 0.4% in May after a 0.5% April gain, pushing three-month growth to its fastest since November.
The view here is that the earlier narrow money / lending slowdown reflected a rise in bank funding costs and an associated tightening of credit conditions caused by changes to money market fund regulations in 2016. These changes resulted in money funds reducing their lending to banks while buying Treasury and agency securities, pushing up funding spreads. Money funds reduced their holdings of bank deposits and commercial paper (CP) by $565 billion during the final three quarters of 2016, according to the Fed’s Z.1 financial accounts.
The portfolio shift appears to have been completed by end-2016, with the latest Z.1 accounts, released last week, showing a $34 billion recovery in money funds’ holdings of deposits and CP in the first quarter of 2017. An associated normalisation of funding spreads has, on the interpretation here, been a key driver of the pick-up in narrow money and credit.
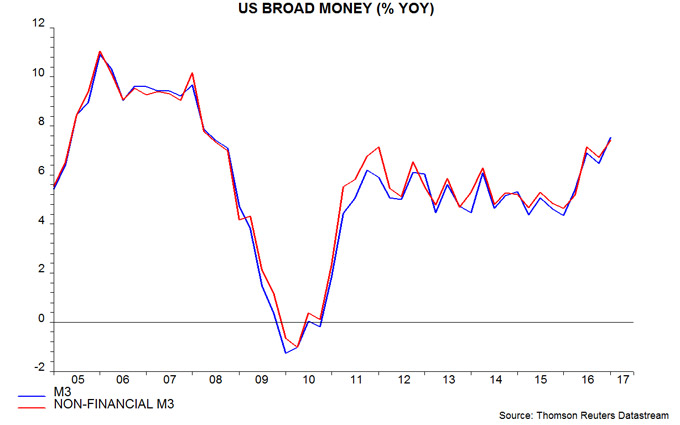
Broad money, meanwhile, continues to expand robustly. The Fed stopped publishing M3 data in 2006 but a quarterly series can be derived from the Z.1 accounts. Annual growth of this measure rose to 7.5% at end-March, the fastest since 2008 – second chart.
There is some confusion about broad money trends at present. The ShadowStats website produces a monthly M3 estimate and claims that annual growth was only 3.3% in April. There is, however, a problem with the ShadowStats methodology – M3 is estimated by adding large time deposits at commercial banks (among other items) to the official M2 series but these deposits include holdings of money market funds, which should be excluded to prevent double-counting (i.e. M3 should include the liabilities but not assets of money funds). As noted above, money funds have slashed their deposit holdings over the past year, resulting in the ShadowStats measure understating M3 growth.

Reader Comments (2)
I would be interested in your views about the state of the 'Credit Impulse' at present.
The credit impulse – i.e. the rate of change of credit growth – has a variable relationship with the economic cycle, and is typically coincident rather than leading.
The current negative US credit impulse is consistent with recent soft economic performance (i.e. sub-par GDP growth in the fourth and first quarters).
As noted in the post, bank lending has started to revive, suggesting that the credit impulse will turn positive again later in 2017, coinciding with stronger economic growth.