US money trends suggesting mid-year "soft patch"
The US economy picked up speed in the second half of 2016 and has started 2017 strongly. This acceleration was predicted by monetary trends, which now suggest a slowdown over the spring and summer. The slowdown may be modest and temporary, partly reflecting the current positive status of the Kitchin stockbuilding and Juglar business investment cycles. It may, however, constrain the Federal Reserve’s rate-hiking plans.
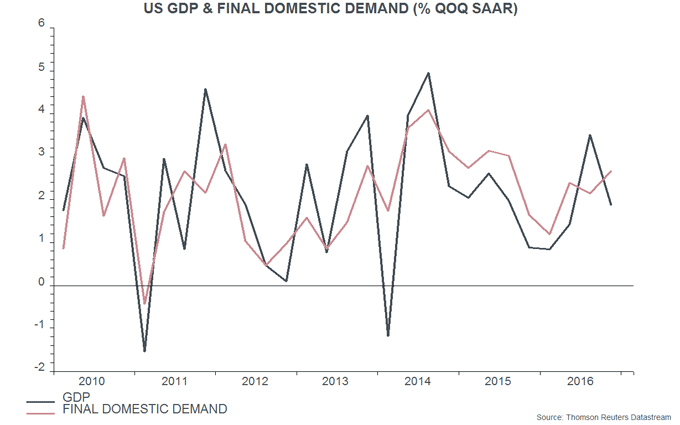
GDP growth fell to 1.9% annualised in the fourth quarter of 2016 from 3.5% in the third, reflecting a normalisation of agricultural exports after a temporary surge. Growth of final domestic sales strengthened between the two quarters, from 2.1% to 2.7% – see first chart.

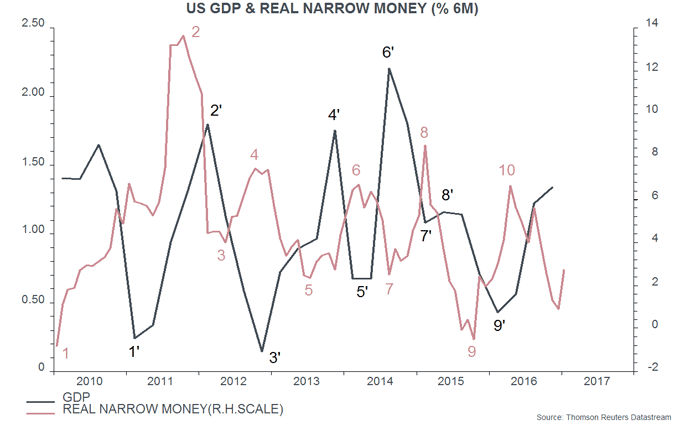
The two-quarter rise in GDP in the fourth quarter was the strongest since the fourth quarter of 2014. As previously discussed, swings in six-month real narrow money expansion have consistently led fluctuations in two-quarter GDP growth in recent years – second chart. GDP acceleration in late 2016 had been predicted by stronger real narrow money growth in late 2015 / early 2016.

The Federal Reserve last week revised its historical money stock data to incorporate updated seasonal adjustments. According to the revised figures, six-month real narrow money growth peaked in April 2016 – four months earlier than previously reported. Allowing for an average nine-month lead from money to activity, with a normal range of six to 12 months, this suggests that two-quarter GDP growth will peak in the first quarter of 2017, plus or minus one quarter.
Real money growth held up through August 2016 but then fell sharply into December, suggesting an economic slowdown from late spring through September 2017.
Could the economy be seriously weak later in 2017? This is not the central scenario here, for two reasons. First, real money growth appears to have staged a partial recovery in January, based on weekly data through mid-month – the last data point on the second chart is a January estimate.
Secondly, serious economic weakness during the second half would be at odds with the assessment here that the Kitchin stockbuilding and Juglar business investment cycles will remain in upswings throughout 2017.
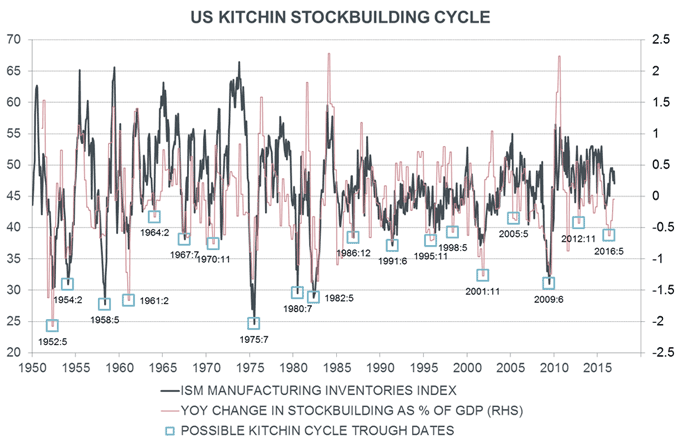
The Kitchin cycle, usually described as being of between three and five years’ duration, is judged here to have bottomed in mid-2016. The third chart shows an attempt to identify troughs in this cycle over the last 65+ years using two indicators – the Institute for Supply Management manufacturing inventories index and the contribution of stockbuilding to the annual change in GDP. The latter series reached a level consistent with a trough in mid-2016. This date would also fit with the suggested timing of the previous trough in late 2012 – the average interval between troughs over the whole period shown in the chart has been three years and seven months.

Kitchin cycle upswings usually last for at least 18 months. A mid-2016 trough would imply that the cycle will continue to provide a tailwind to the economy through end-2017.
As an aside, the strength of stock and commodity prices since mid-2016 is consistent with the Kitchin cycle having moved into an upswing. Based on the dates in the chart, the S&P 500 index rose on average by 14.7% percentage points (pp) more in the 18 months following a Kitchin cycle trough than in the prior 18 months. The Journal of Commerce industrial commodity price index rose on average by 20.2 pp more in the post- than pre-trough 18 months.
The Juglar business investment cycle is usually of seven to 11 years’ duration and last bottomed in 2009, implying that another trough is due by 2020. The upswing, however, was interrupted in 2014-15 by the collapse in energy prices and associated profits weakness. With this drag now reversing, a late burst of strength is possible in 2017-18 before the cycle moves into another low.

Reader Comments