When will global growth revive?
Global six-month industrial output growth was expected here to recover from mid-year, following a rise in real narrow money expansion in early 2014 and an accompanying firming of leading indicators. It appears, instead, to have fallen to a new low in August, based on available country data – see first chart. Has the expected revival been postponed or cancelled?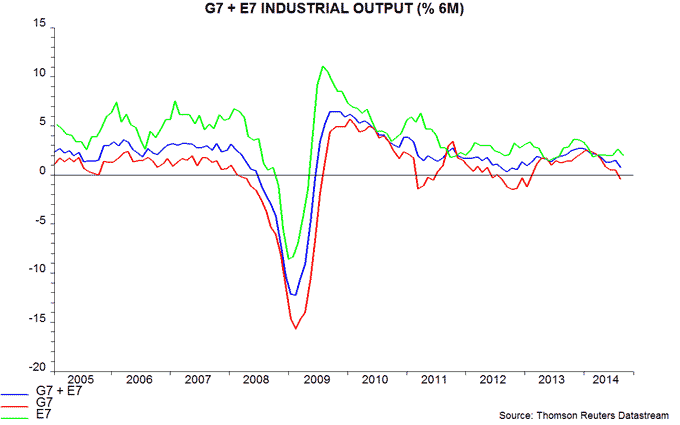
Note, first, that the further weakening into August is consistent with normal variation in the real money / activity relationship. Real money growth bottomed in November 2013 and leads turning points in output momentum by six months on average. The lead time in recent cycles, however, has extended as long as 11 months, suggesting that an output growth trough could occur as late as October 2014.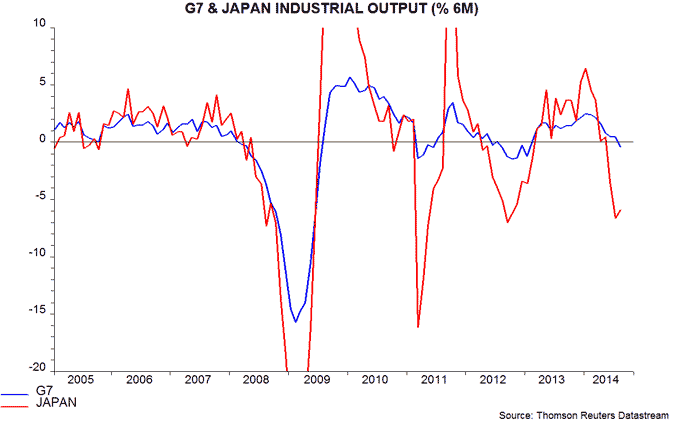
The extension of the global slowdown mainly reflects a further fall in G7 output growth – first chart. This, in turn, owes much to a continued production adjustment in Japan, where demand significantly undershot firms’ expectations following April’s sales tax hike – second chart. There is some similarity with the demand / output shock associated with the 2011 Tohoku earthquake, which exacerbated a "soft patch" in the global upswing.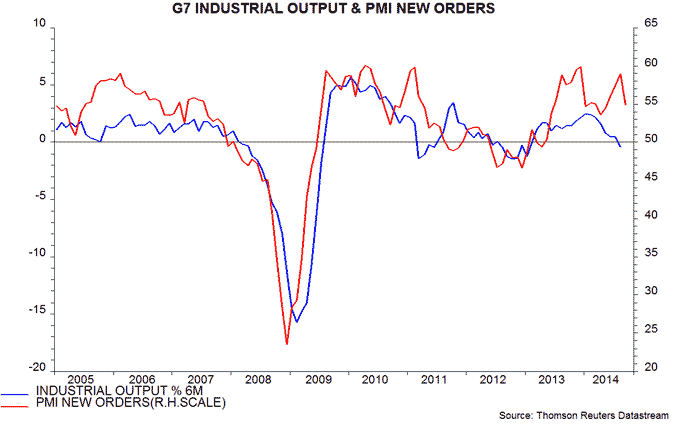
The Japan effect may help to explain the recent divergence of industrial output data and business surveys. G7 manufacturing purchasing managers’ surveys strengthened between April and August, consistent with the growth revival scenario, but reversed much of the gain in September – third chart. There was a similar breakdown in the output / surveys relationship in 2011: the PMIs were overoptimistic at the start of the year but then weakened significantly even as activity rebounded.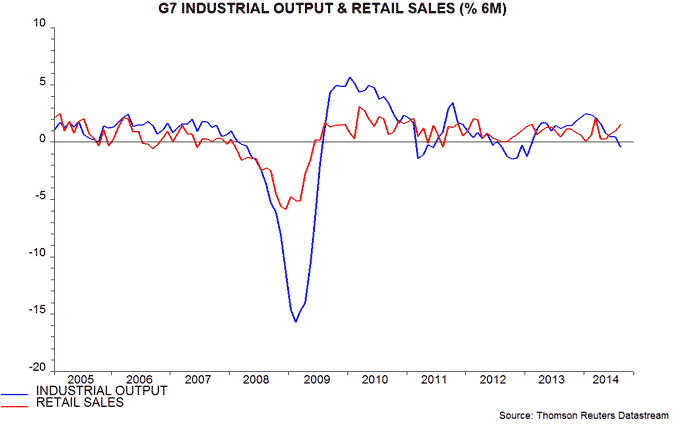
One development consistent with an imminent output recovery is a pick-up in retail sales momentum through August – fourth chart. The positive divergence with output suggests that the stocks cycle is moving into a more favourable phase. Rises in the sales / output ratio are usually followed by a significant increase in output growth – fifth chart. An energy-driven fall in consumer price inflation may support retail demand near term.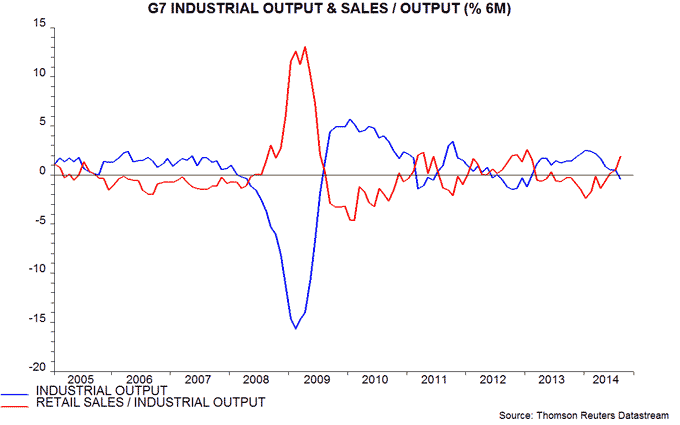
The positive retail sales / industrial output divergence extends to Japan – sixth chart (showing levels rather than growth rates).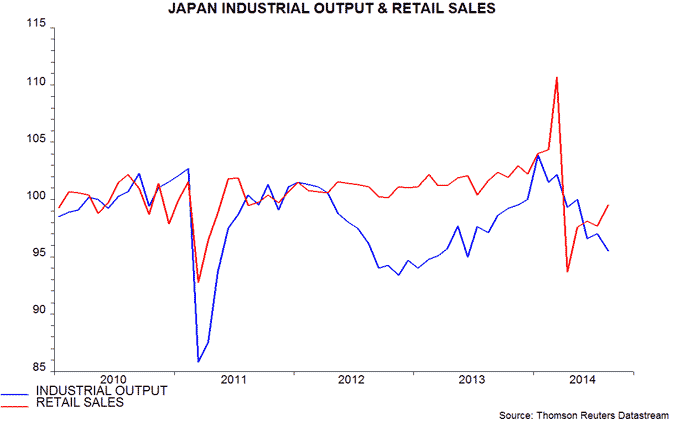
The favoured scenario of a near-term recovery in output growth will be maintained unless real money expansion or the longer leading indicator tracked here weaken notably. An August leading indicator reading will be available later this week. Global real narrow money growth fell in August but this mainly reflects a decline in the US, which appears to have reversed in September – see previous post.

Reader Comments