
US stock market rise stretched relative to history
 Simon Ward
 Post a Comment
Previous posts have compared the rise in the Dow Jones Industrials index from its March 2009 low with increases after six previous bear markets involving a peak-to-trough fall of about 50%. (The Dow declined by 54% between October 2007 and March 2009.) As explained below, the Dow is currently outpacing these prior rises.
The six bear market troughs considered in this analysis occurred in November 1903, November 1907, December 1914, August 1921, April 1942 and December 1974. The Dow Industrials fell by between 45% and 52% into these lows. (The 1929-32 bear market was excluded because it involved a much larger decline, of 89%.) In each of the six cases, the trough of the bear market was rebased and shifted forwards in time to match the March 2009 low. The subsequent rises were then traced out and an average calculated – see chart.
This “six-recovery average” proved to be a good guide to the underlying trend in US stocks over the two-and-a-half years following the 2009 trough. Since late 2011, however, the Dow has diverged positively from the average and is currently above the top of the range spanned by the historical rises.
The closest resemblance is to the “roaring twenties” increase from the August 1921 trough – the black line in the chart. The equivalent month to November 2013 was May 1926. If the Dow were to replicate its performance then, it would rise to 17,000 in February 2014 before falling back to 15,000 in April. It would make no net progress between now and July 2014.
The fall from the equivalent of 17,000 to 15,000 occurred in September-October 1926 as the US economy was entering a 13-month recession. This recession followed a rise in short-term interest rates – the three-month Treasury bill rate increased from less than 2% in 1924 to more than 3.5% – and a stagnation of the narrow money supply.
Bulls argue that there is no recession in sight while unprecedented central bank monetary manipulation will continue to force investors into equities, making historical comparisons redundant. The assessment here is more cautious: longer-term bond yields have risen significantly, the global real money supply is no longer outpacing output and growth may be reaching a peak – see yesterday’s post. The historical suggestion that the Dow is overstretched and will, at best, tread water through mid-2014 may prove more than a curiosity.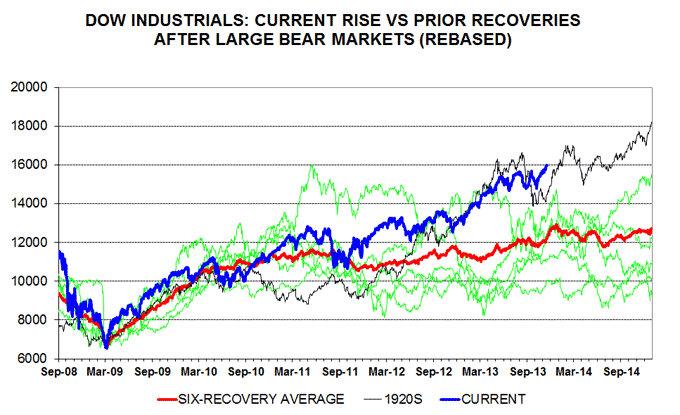
 View Printer Friendly Version
 Email Article to Friend
Reader Comments