

Why the UK MPC should stand pat
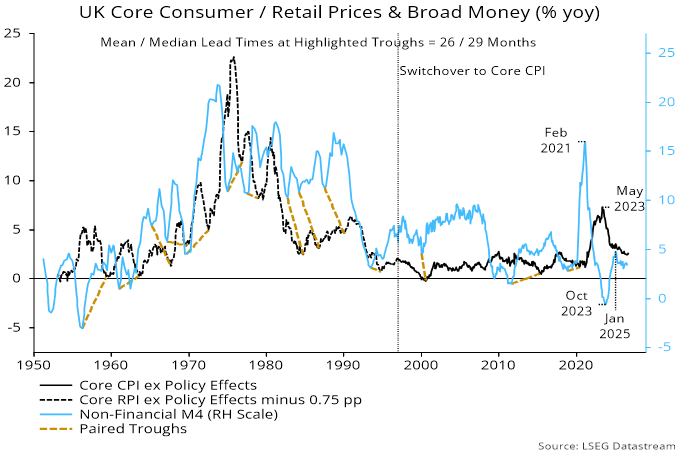
Turning points in UK annual broad money growth have led those in annual core CPI / RPI inflation by a median 28 months in the post-war period – 27 months at peaks and 29 at troughs. Charts 1 and 2 show the paired highs and lows used to calculate these averages.
Chart 1
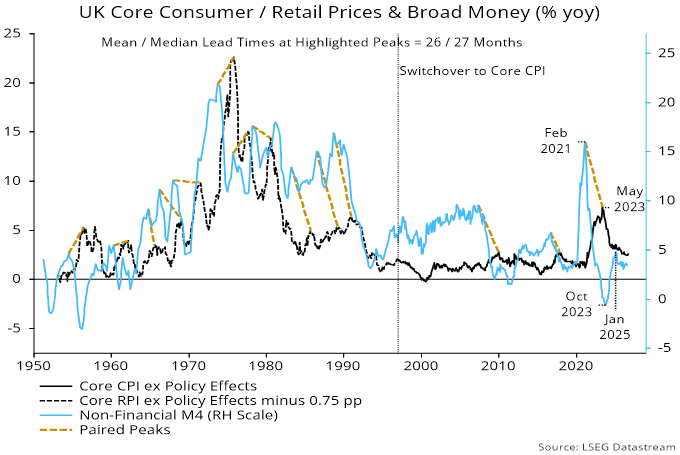
Chart 2
The annual rate of change of broad money – as measured by non-financial M4 – bottomed in October 2023. Based on the median lead, a previous post suggested that annual core inflation would trough by March 2026.
The low, instead, was reached in April at 2.5%, with the core rate moving sideways over the summer, rising to 2.8% in September.
The level at the low was significantly higher than had been expected here. Disinflationary pressure from extreme monetary weakness in 2023 was offset by cost-push shocks from government policies and now Gulf War III.
How long will the current upswing last?
The recovery in money growth from the October 2023 low was minor and short-lived. Annual expansion peaked at 4.8% in January 2025. Allowing for the median lead of 27 at peaks, this suggests a core inflation top around April 2027.
Annual broad money growth subsequently fell to a low of 3.0% in January 2026, remaining weak through August (3.4%). Monetary effects, therefore, should be pushing down on inflation during H2 2027 and into 2028.
Additional policy tightening now would reinforce this trend, risking unnecessary damage to the economy and an eventual inflation undershoot.