US money update: suspect deposit data
A sharp rise in US demand deposits in November probably reflects a statistical distortion. Monetary trends overall remain consistent with moderate nominal economic expansion.
The narrow money measure tracked here – M1A, comprising currency and demand deposits – jumped by 6.8% in November, pushing six-month growth up to 19.9% annualised from 5.4% in October – see chart 1.
Chart 1
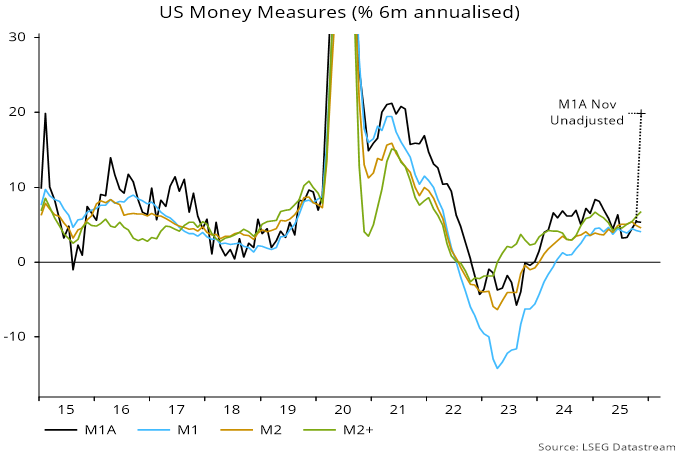
This surge, if genuine, would suggest a significant pick-up in economic growth during H1 2026, with associated upward pressure on interest rates.
The assessment here, however, is that the November jump likely reflects a statistical distortion cause by a bank or banks reclassifying savings deposits as demand deposits on the FR2900 reporting form.
Weekly unadjusted data show a large rise in demand deposits in the third and fourth weeks of November, with a corresponding drop in “other liquid deposits”, which include savings deposits – chart 2.
Chart 2
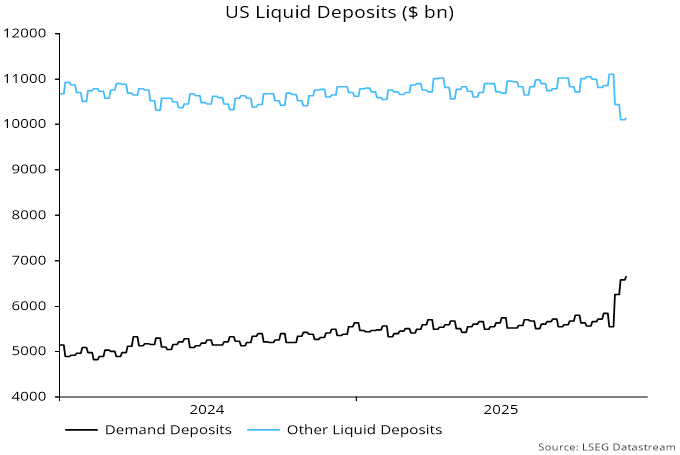
The weekly numbers are averages of daily figures. The hypothesis of a reclassification is consistent with the demand deposit increase being spread over two weeks of data, assuming that the day of the change was after the start of the first week, resulting in a carry-over to the average for the following week.
A genuine surge in demand deposits would be expected to play out over multiple weeks. The change in the latest week – ending 1 December – returned to “normal”. Data for the remainder of December will be important for confirming the reclassification hypothesis.
Similar reclassifications appear to have occurred in several months over 2020-22, following removal of reserve requirements in March 2020, which effectively equalised the treatment of demand and savings deposits. The procedure adopted then was to assume that monthly growth of demand deposits would have matched that of total liquid deposits in the absence of the distortion.
Applying the same adjustment now suggests “true” six-month growth of M1A in November of 5.3% annualised, little changed from October.
The official M1 and M2 aggregates, as well as the broader M2+ measure calculated here, include savings deposits so are unaffected by such reclassifications. Six-month growth rates of the three measures were 4.1%, 4.6% and 6.7% annualised respectively in November – chart 1.
These growth rates are in a range consistent with trend economic expansion and inflation around the 2% target. Current money trends, in other words, give no strong grounds for monetary policy changes in either direction.