US money supply / demand in broad balance
The US economy and markets previously enjoyed a tailwind from an “excess” stock of money relative to prevailing levels of nominal spending and asset prices. A post in December argued that nominal economic growth and rising markets had eliminated this excess by mid-2024, with a small monetary shortfall opening up Q3. An updated analysis suggests that recent weakness in equities has been insufficient to restore a surplus.
To recap, the “quantity theory of wealth”, explained in posts in 2020, is a suggested modification of the traditional quantity theory recognising that (broad) money demand depends on (gross) wealth as well as income and proposing equal elasticities. Nominal income Y is replaced on the right-hand side of the equation of exchange MV = PY by a geometric mean of income and wealth.
Chart 1 applies the “theory” to US data since end-2014. Nominal GDP is used as the measure of income, with wealth defined as the sum of market values of public equities, debt securities (excluding Fed holdings) and the housing stock.
Chart 1
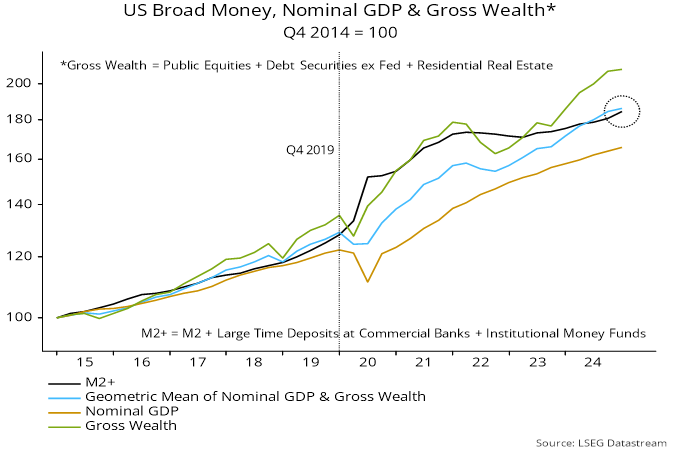
The combined income / wealth variable closely tracked moderate growth of broad money over 2015-19. Wealth rose faster than income, so traditionally-defined velocity fell. The velocity of the combined income / wealth measure was stable.
Policy easing following the covid shock resulted in possibly unprecedented monetary disequilibrium. Asset prices responded swiftly to the excess, causing wealth to overshoot broad money in 2021 before a sharp correction in 2022.
The combined income / wealth measure was still well below the level implied by broad money even before this set-back. Deployment of excess money fuelled a second surge in wealth from late 2022 while sustaining economic growth despite monetary policy tightening.
Asset price gains, goods / services inflation and real economic expansion resulted in the income / wealth measure finally catching up with broad money in mid-2024, with a small overshoot emerging in Q3. The velocity of the combined measure, in other words, had fully reversed its pandemic fall.
Asset stock numbers in the Q4 financial accounts released last week allow the calculation to be updated to end-2024. Broad money grew slightly faster than the combined income / wealth measure in Q4 but not by enough to close the end-Q3 gap.
Has the recent equity market correction pushed the combined measure back below the level implied by the money stock? Available information suggests not: ongoing growth in the stock of debt securities along with rising goods / services prices may have offset the decline in equities – unless the economy turns out to have contracted in Q1. Broad money, meanwhile, grew modestly in January, with a February number released next week.
The previous monetary excess imparted a positive skew to the economy / markets so its withdrawal suggests greater vulnerability to negative developments.