Surprising US monetary strength
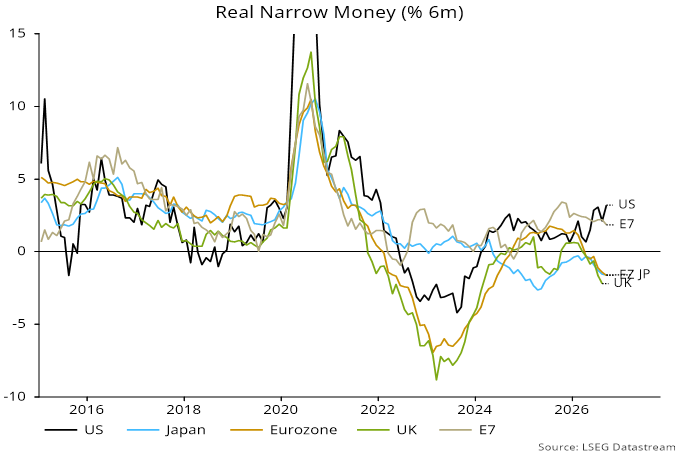
Additional information confirms that global six-month real narrow money momentum eased further in September but the decline was smaller than projected in a post last week, reflecting a surprise rebound in the US component to a new high – see charts 1 and 2.
Chart 1
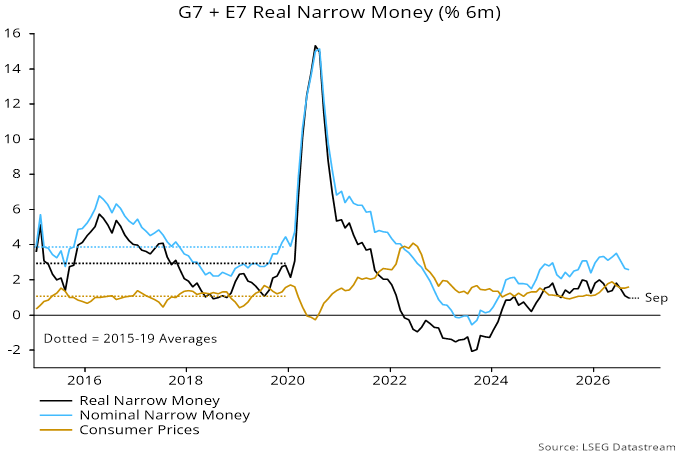
Chart 2
The decline in the global measure from a February peak signals a loss of economic momentum in late 2026 / early 2027 but the current indication is for cooling rather than significant weakness.
The September fall in global momentum was driven by faster contractions in Japan and the Eurozone coupled with a slowdown in the E7 component – chart 2.
The further widening of the US / rest of G7 differential suggests US relative economic strength and misaligned monetary policies, with the Fed behind the curve but the ECB and Bank of Japan already in overrestrictive territory.
Broad money trends echo this message, with US M2+ rising at a 7.5% annualised rate in six months to September versus growth in Japanese M3 and Eurozone non-financial M3 of 0.8% and 3.0% respectively.
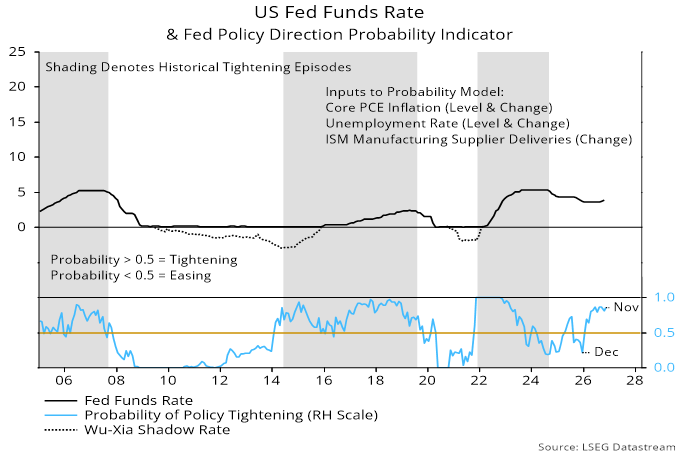
Fed officials – with the possible exception of Chair Warsh – give no weight to monetary signals but coincident economic indicators that have informed policy decisions historically also imply a need for tightening. The simple Fed model followed here estimates the probability of a further hike at 86%, based on current and lagged values of the unemployment rate, annual core PCE inflation and the ISM manufacturing delivery delays indicator – chart 3.
Chart 3
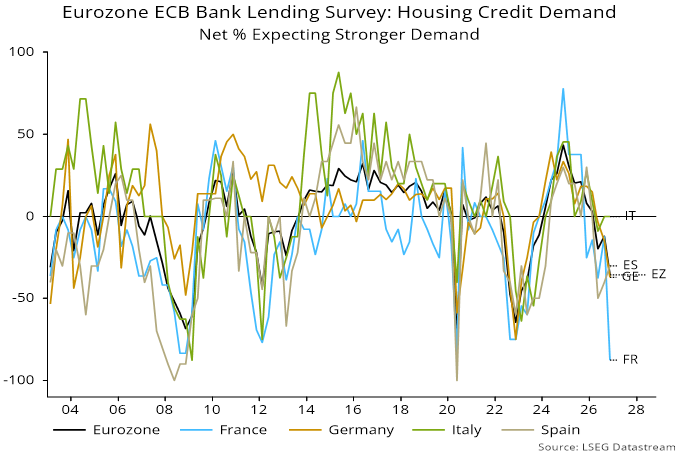
The monetary message of deteriorating Eurozone economic prospects, meanwhile, is supported by the ECB’s Q4 bank lending survey, showing a fall in credit demand balances across loan categories, led by housing – chart 4. French expected housing credit demand plunged to a record low, with the German balance also weaker and Spanish lenders remaining downbeat – chart 5.
Chart 4
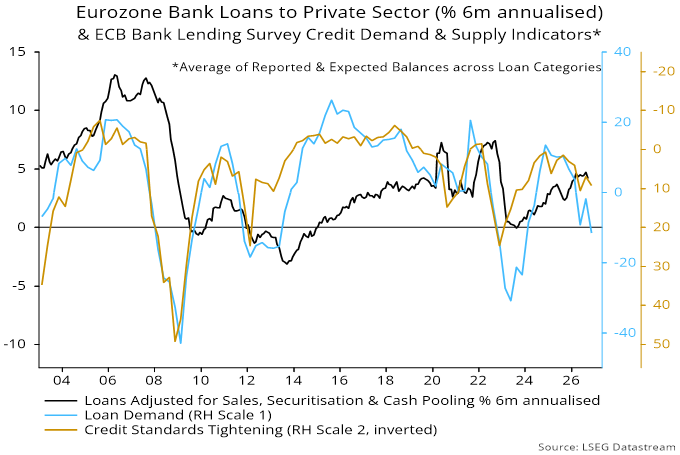
Chart 5