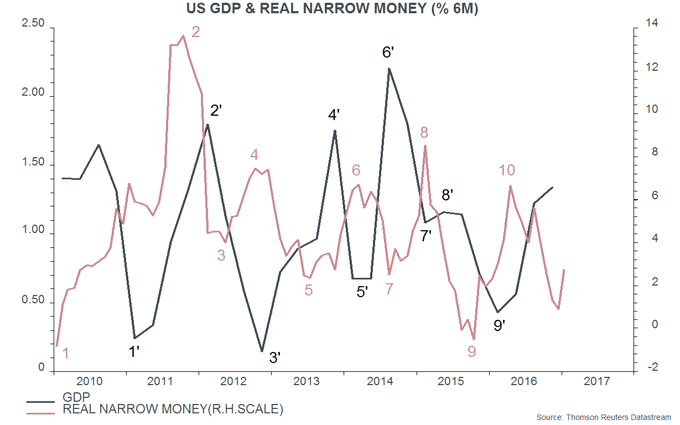
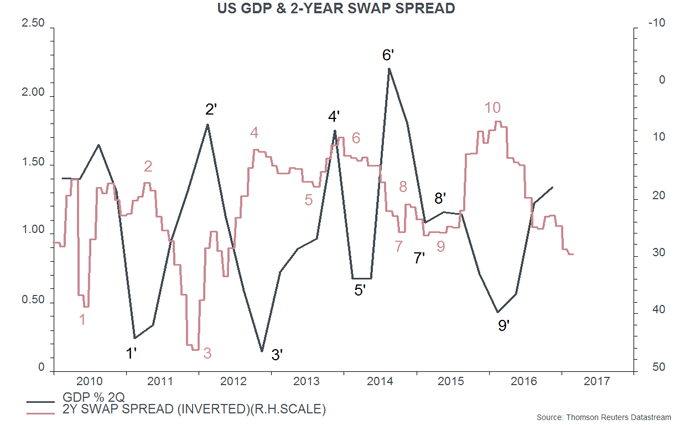
US narrow money trends suggest a moderation of economic growth in the spring / summer – see post from last week. The two-year swap spread has also led economic fluctuations historically and is giving a similar cautionary message.
The swap spread is a component of the Conference Board’s leading credit index, which feeds into its leading economic index. The spread measures the cost of bank funding over and above the level of “safe” market rates. A rise in the spread indicates that the supply of funding has fallen relative to demand, and may be associated with a reduction in credit supply and higher bank lending / deposit rates.
Narrow money is viewed here as being demand-determined and influenced importantly by spending intentions, explaining why it leads the economy. A reduction in credit supply / higher bank interest rates discourage spending, which may partly account for an observed inverse correlation between narrow money trends and the swap spread.
The first chart, reproduced from the earlier post, shows that turning points in six-month real narrow money growth have consistently led those in two-quarter GDP growth in recent years. The second chart shows a similar relationship with the inverted swap spread.


The spread, while still low by historical standards, has widened steadily since early 2016, reaching its highest level since 2012. Why?
One explanation is last year’s reform of money market fund regulations, which resulted in a large movement out of “prime” funds able to invest in a wide range of assets – including bank liabilities – into those limited to government securities. This reduced the supply of bank funding and probably explains a 9% fall in large time deposits at commercial banks during 2016.
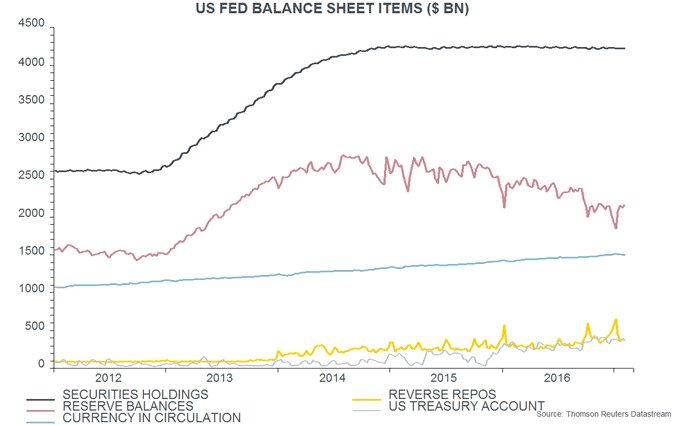
The second explanation is that the Federal Reserve has allowed the stock of bank reserves to contract significantly since late 2015, reducing the pool of “excess” reserves available for lending in the funding market. Reserve balances averaged $2.093 trillion in January, down from $2.668 trillion in October 2015 – a 22% drop over 15 months.
The fall in reserves does not reflect any reversal of QE: in line with its stated policy, the Fed has been reinvesting principal repayments and its securities portfolio has remained stable – third chart.

The fall in reserves, instead, has been mainly due to three changes on the liabilities side of the Fed’s balance sheet:
-
“Normal” growth of currency in circulation: banks obtain additional currency for their customers by exchanging reserves with the Fed.
-
A rise in the US Treasury’s deposit balance at the Fed: a higher balance reduces bank reserves, unless offset by Fed market operations.
-
Growth of the Fed’s overnight reverse repo program following a lifting of the $300 billion aggregate cap in December 2015.
The reserves fall, therefore, can be argued to have occurred “naturally” rather than being the result of deliberate Fed policy. The Fed, however, has chosen not to offset the decline despite upward pressure on bank funding costs from the money market fund reform.